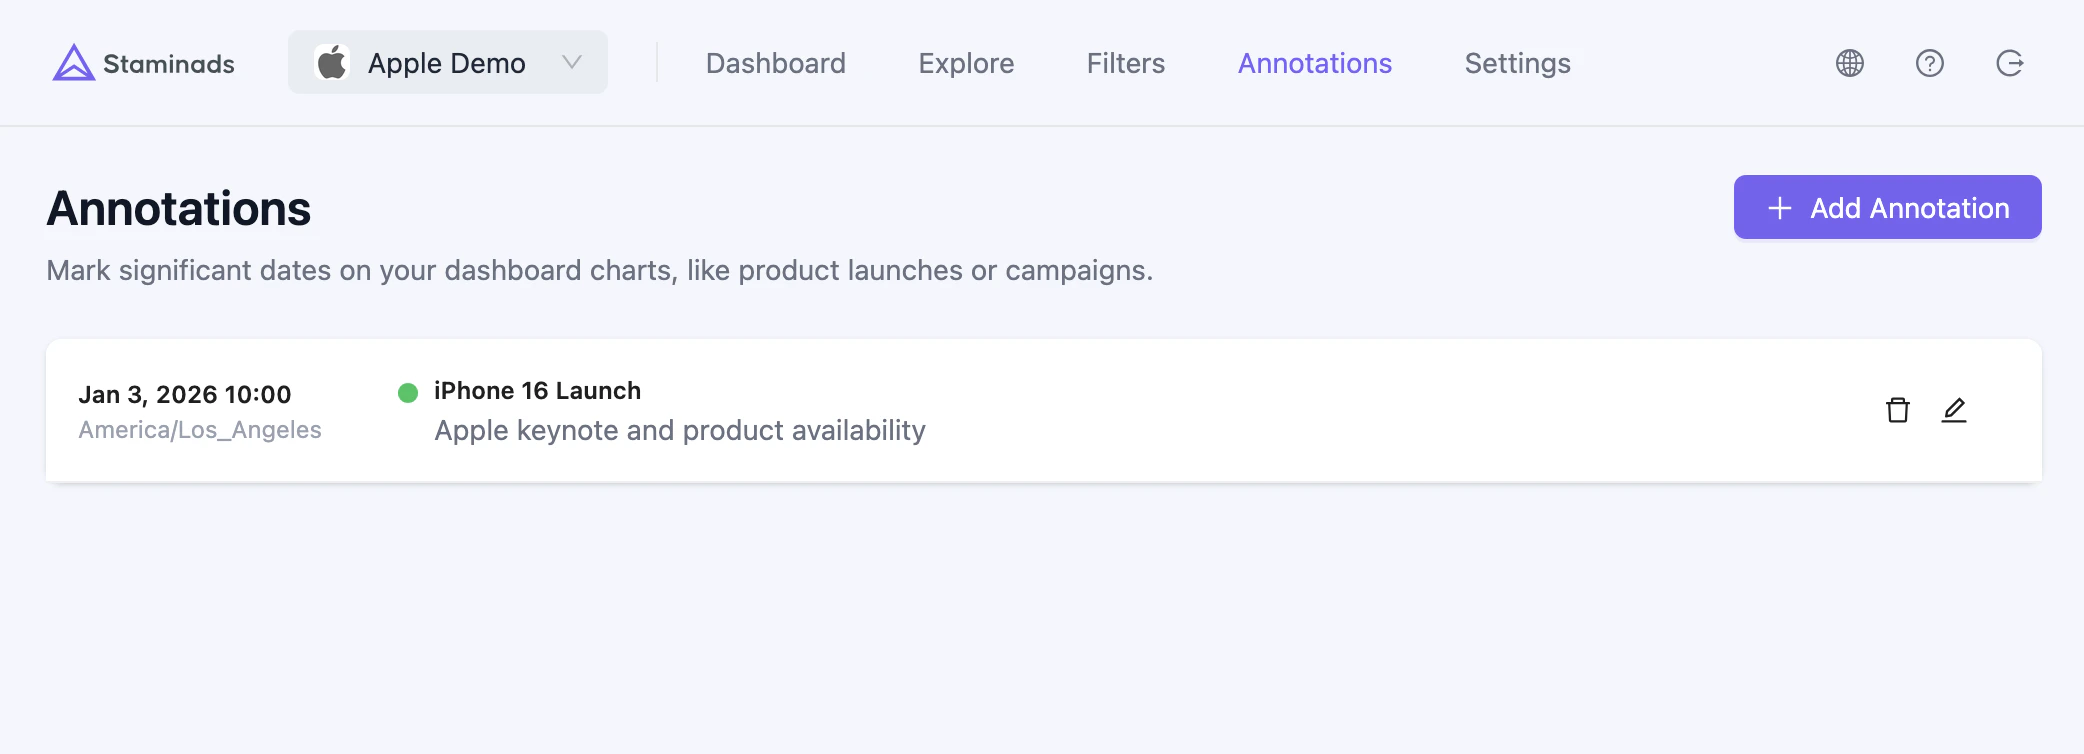
Annotations let you mark significant dates on your charts, helping you correlate traffic patterns with real-world events like campaigns, product launches, or website changes.
Use Cases
- Campaign launches — Mark when a new ad campaign started to see its impact on traffic
- Website changes — Track deployments, redesigns, or content updates
- External events — Note industry events, holidays, or competitor actions
- Technical issues — Document outages or tracking issues for future reference
- Seasonal patterns — Mark recurring events to compare year-over-year
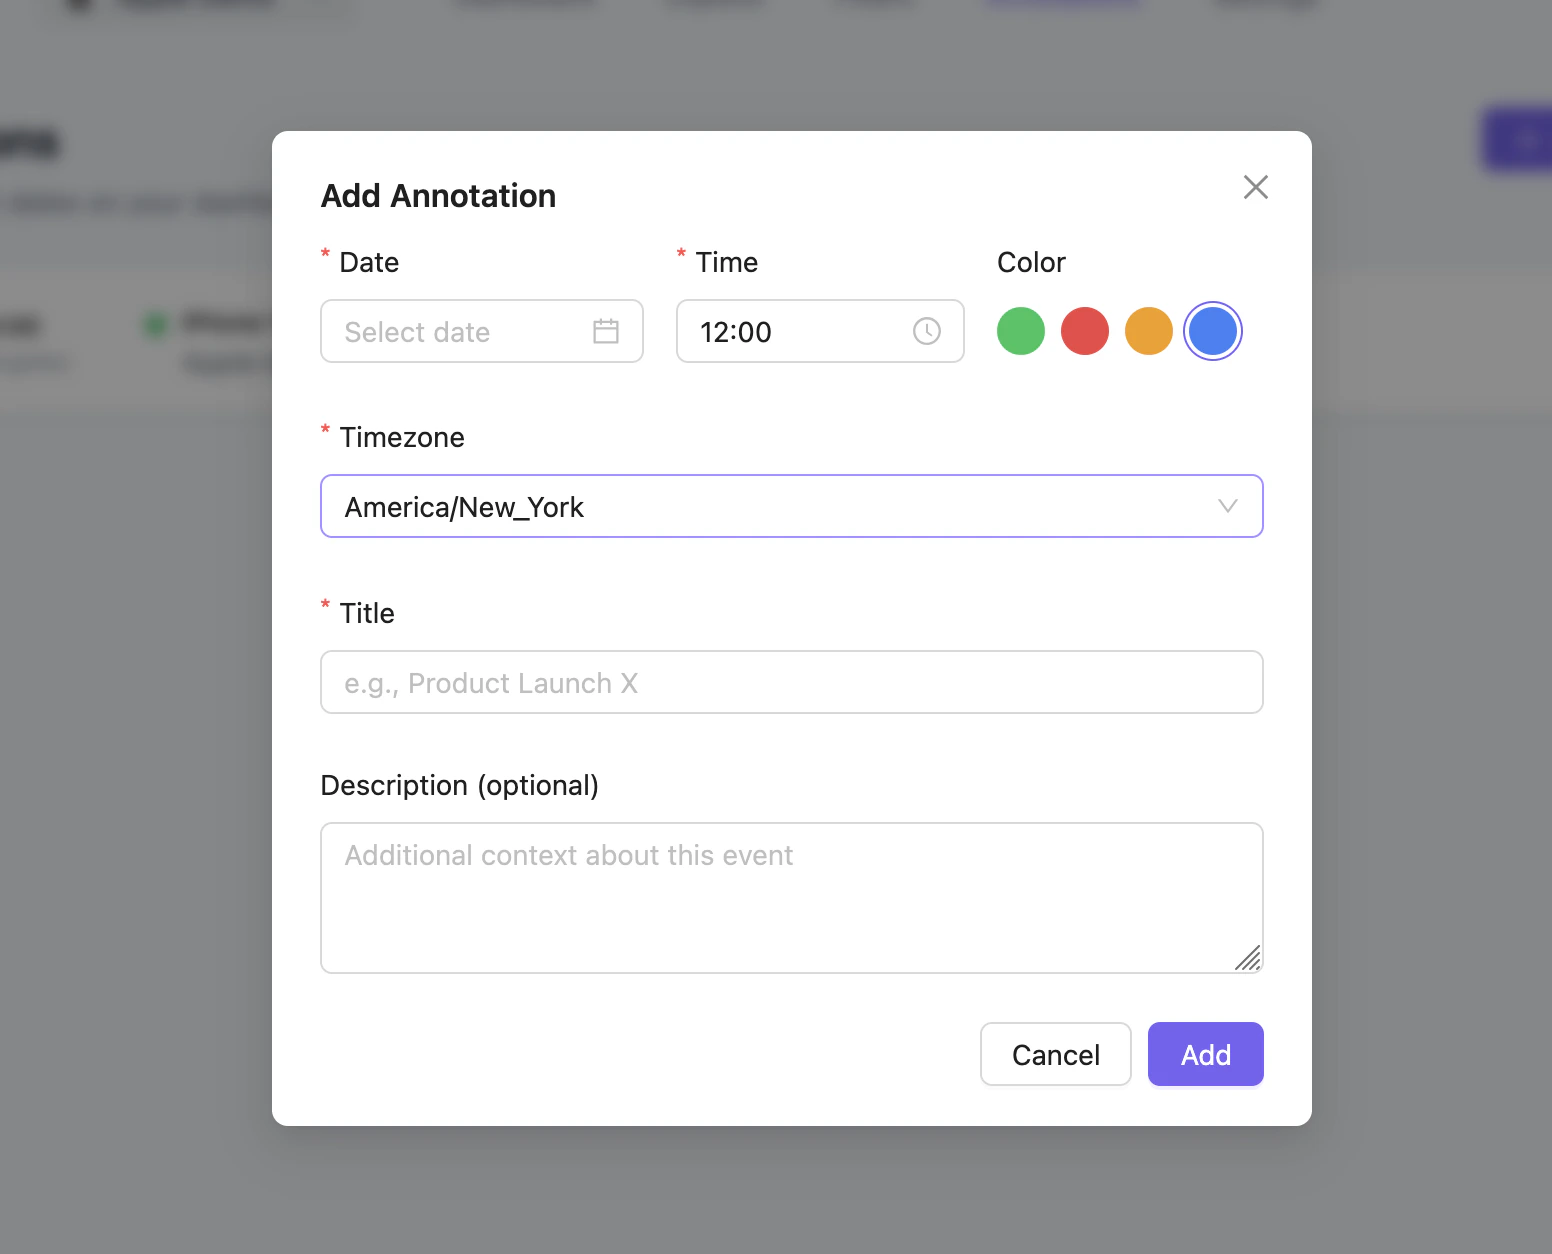
Creating an Annotation
Navigate to Settings > Annotations in your workspace to manage annotations.
Each annotation includes:
Viewing Annotations
Annotations appear as vertical markers on time-series charts. Hover over a marker to see the annotation details.
Use consistent colors to categorize your annotations. For example, use blue for campaigns, green for releases, and red for incidents.
Best Practices
- Be specific — Include enough detail in the description to understand the event months later
- Use accurate times — Set the correct timezone to align annotations with your traffic data
- Keep titles short — Use concise titles that fit on the chart without cluttering
- Clean up old annotations — Remove annotations that are no longer relevant to keep charts readable