Open Source
AGPL-3.0 licensed. Your data, your rules.
Privacy-First
No cookies, no consent banners. GDPR compliant out of the box.
Self-Hosted
Deploy on your own infrastructure. Free forever.
Why Staminads?
The Problem: Conversion Tracking is Broken
Web marketers have relied on conversion tracking (ROI, ROAS) for years. But due to technical and legal constraints, this approach no longer works:Technical Barriers
- Adblockers blocking tracking scripts
- Limited cookie lifespans (7 days on Safari)
- Cross-device journeys impossible to track
- App webviews breaking attribution
Legal Constraints
- GDPR consent requirements
- Cookie banner fatigue (users opt out)
- Privacy regulations tightening globally
- First-party data limitations
The Solution: Engagement-Based Analytics
Conversions don’t happen in one visit. Engagement does. A typical customer journey looks like this:
The role of marketing isn’t to convert — it’s to move the buying process forward. Staminads measures what matters at every step: how engaged your visitors are.
Core Concepts
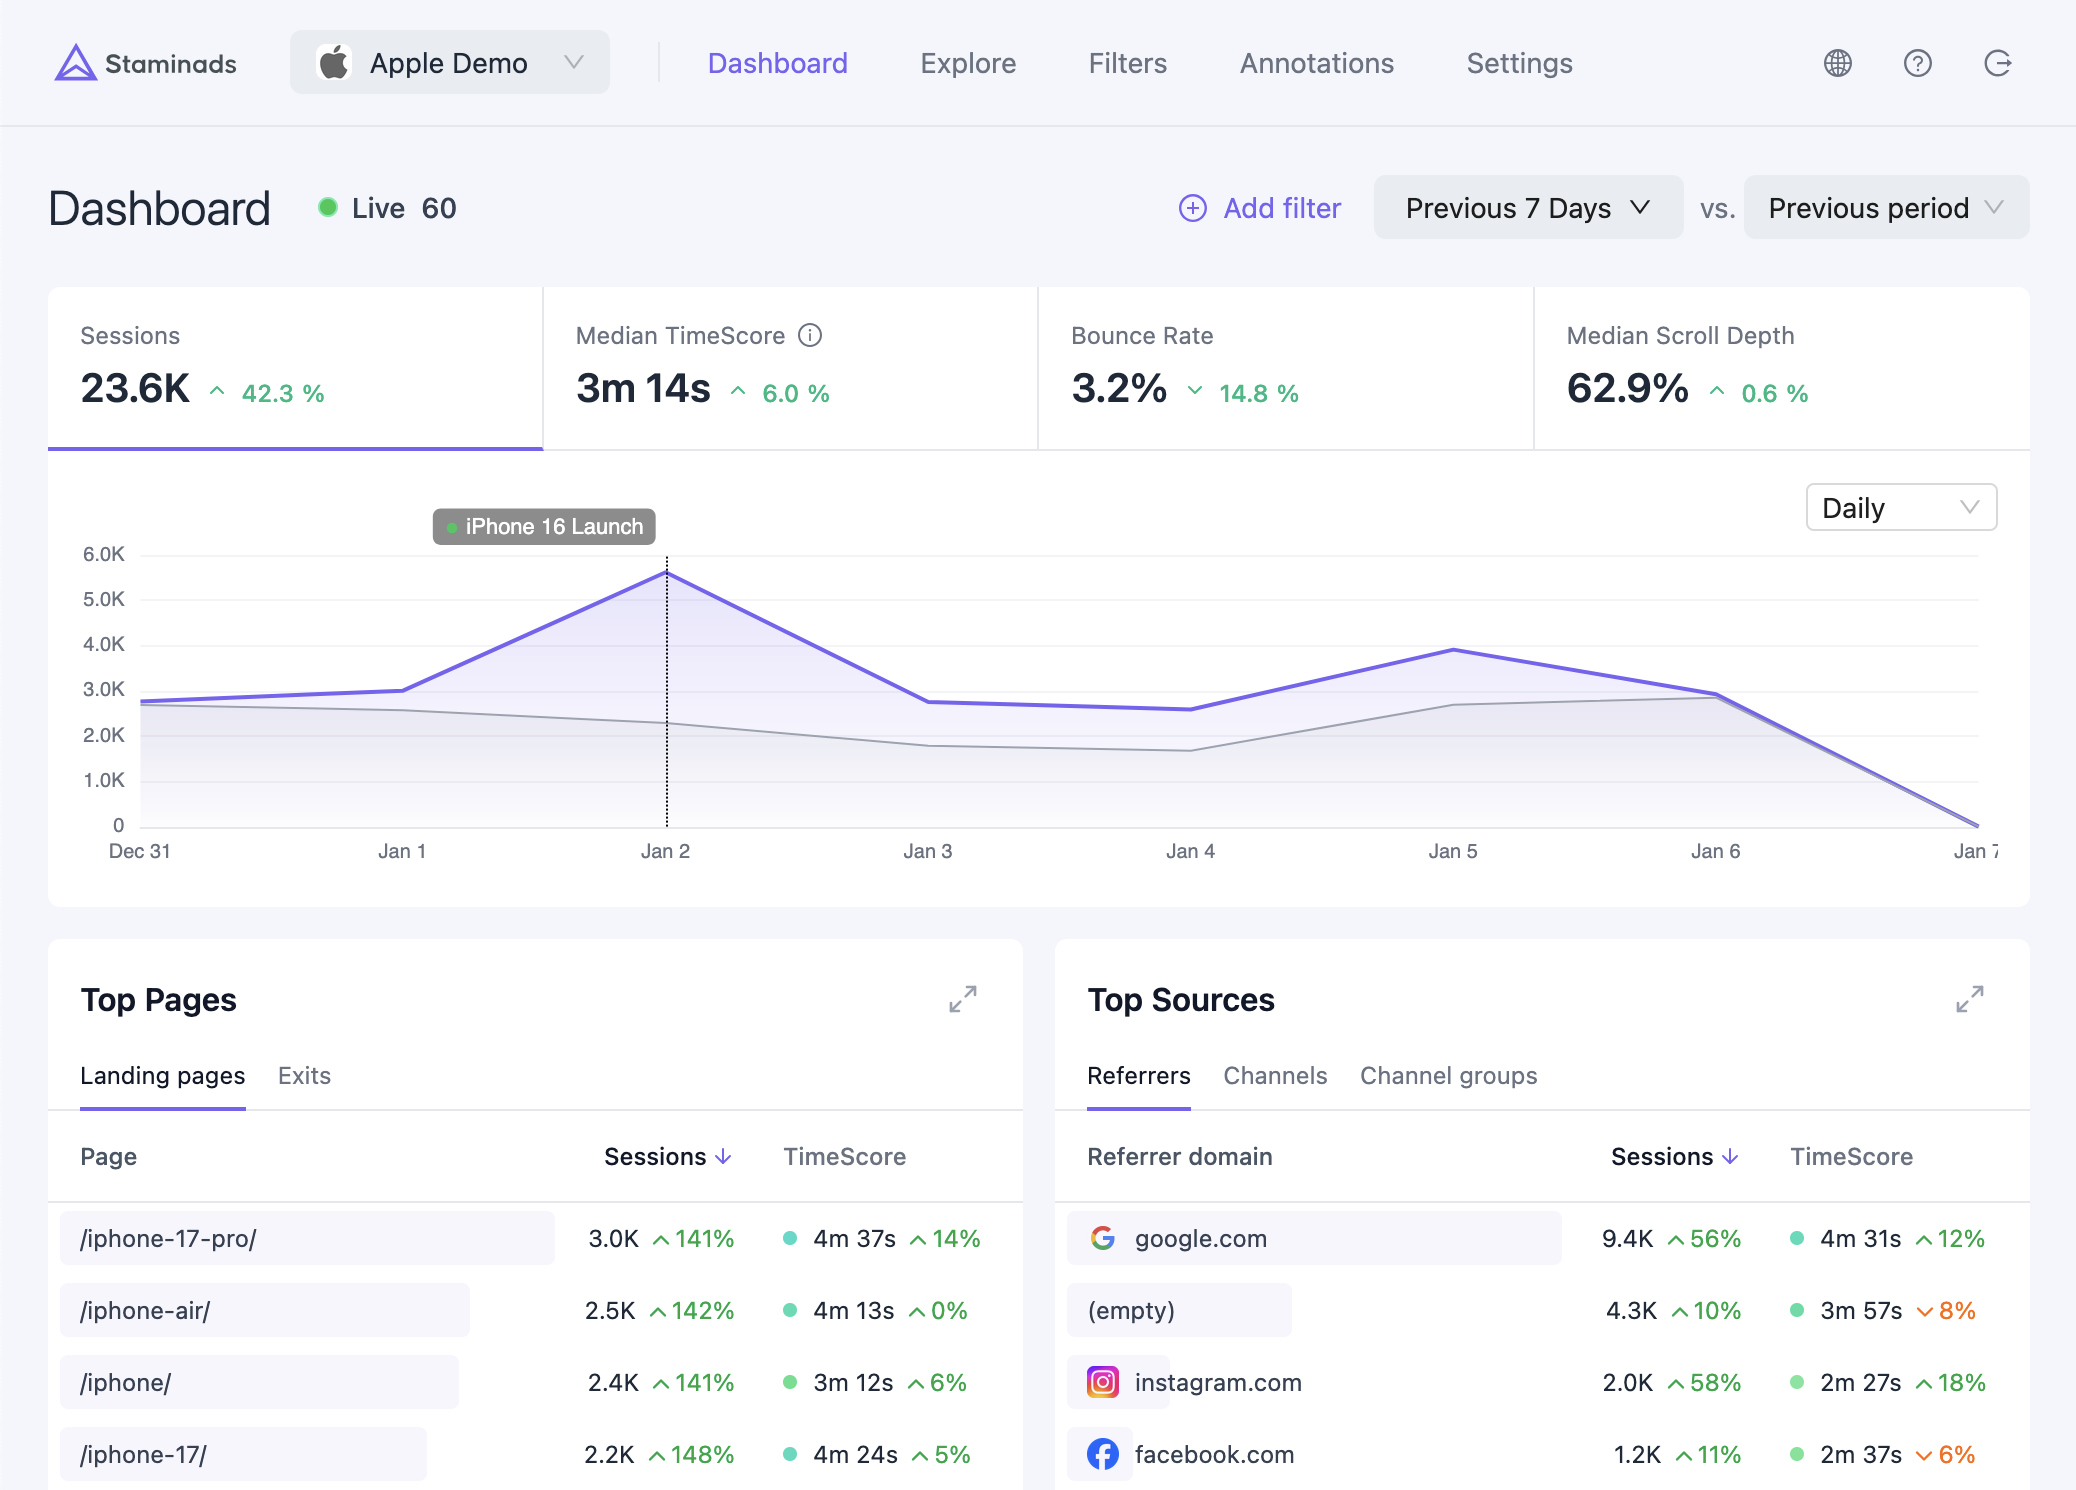
TimeScore
The TimeScore is the median time spent on your website for each traffic source, expressed in seconds. Why median instead of average? Because medians are resistant to outliers — a single visitor leaving a tab open for hours won’t skew your data.TimeScore measures real engagement. A visitor who spends 4 minutes reading your pricing page is more valuable than one who bounces after 10 seconds — regardless of whether they convert today.
Key Features
Traffic Categorization
Separate Google Ads from Google Organic. Group landing pages by product category. Create channel definitions that match your business.
AI Assistant
Ask questions in natural language. “Which traffic source has the best engagement this week?” Get insights without writing queries.
Deep Data Exploration
Drill down by any dimension — source, campaign, country, device, or custom dimensions. Filter and combine in real time.
Multi-Tenant & Team Ready
Isolated workspaces for multiple sites or clients. Granular user roles: Admin, Editor, Viewer.
Built for Speed
Powered by ClickHouse. Sub-50ms query latency. Handle billions of events without breaking a sweat.
Mobile Friendly
Fully responsive dashboard. Check your analytics on any device.
Next Steps
Installation
Deploy Staminads on Railway, PikaPods, or your own infrastructure with Docker.
Explore Report
Deep dive into your data to find insights and optimize your traffic sources.
Traffic Categorization
Create filter rules to categorize traffic by channel, page type, or custom dimensions.
View on GitHub
Star the repo, report issues, or contribute to the project.