- Dashboard: Get an overview of your digital marketing performance.
- Explore: Deep dive into your data by any dimensions to find insights.
- Google Ads: Measure the performance of your Google Ads account and get specific insights to optimize your campaigns.
Dashboard
- Quantity: Volume of sessions
- Quality: Global TimeScore
- Time spent distribution
- Marketing mix (by channels groups and channels)

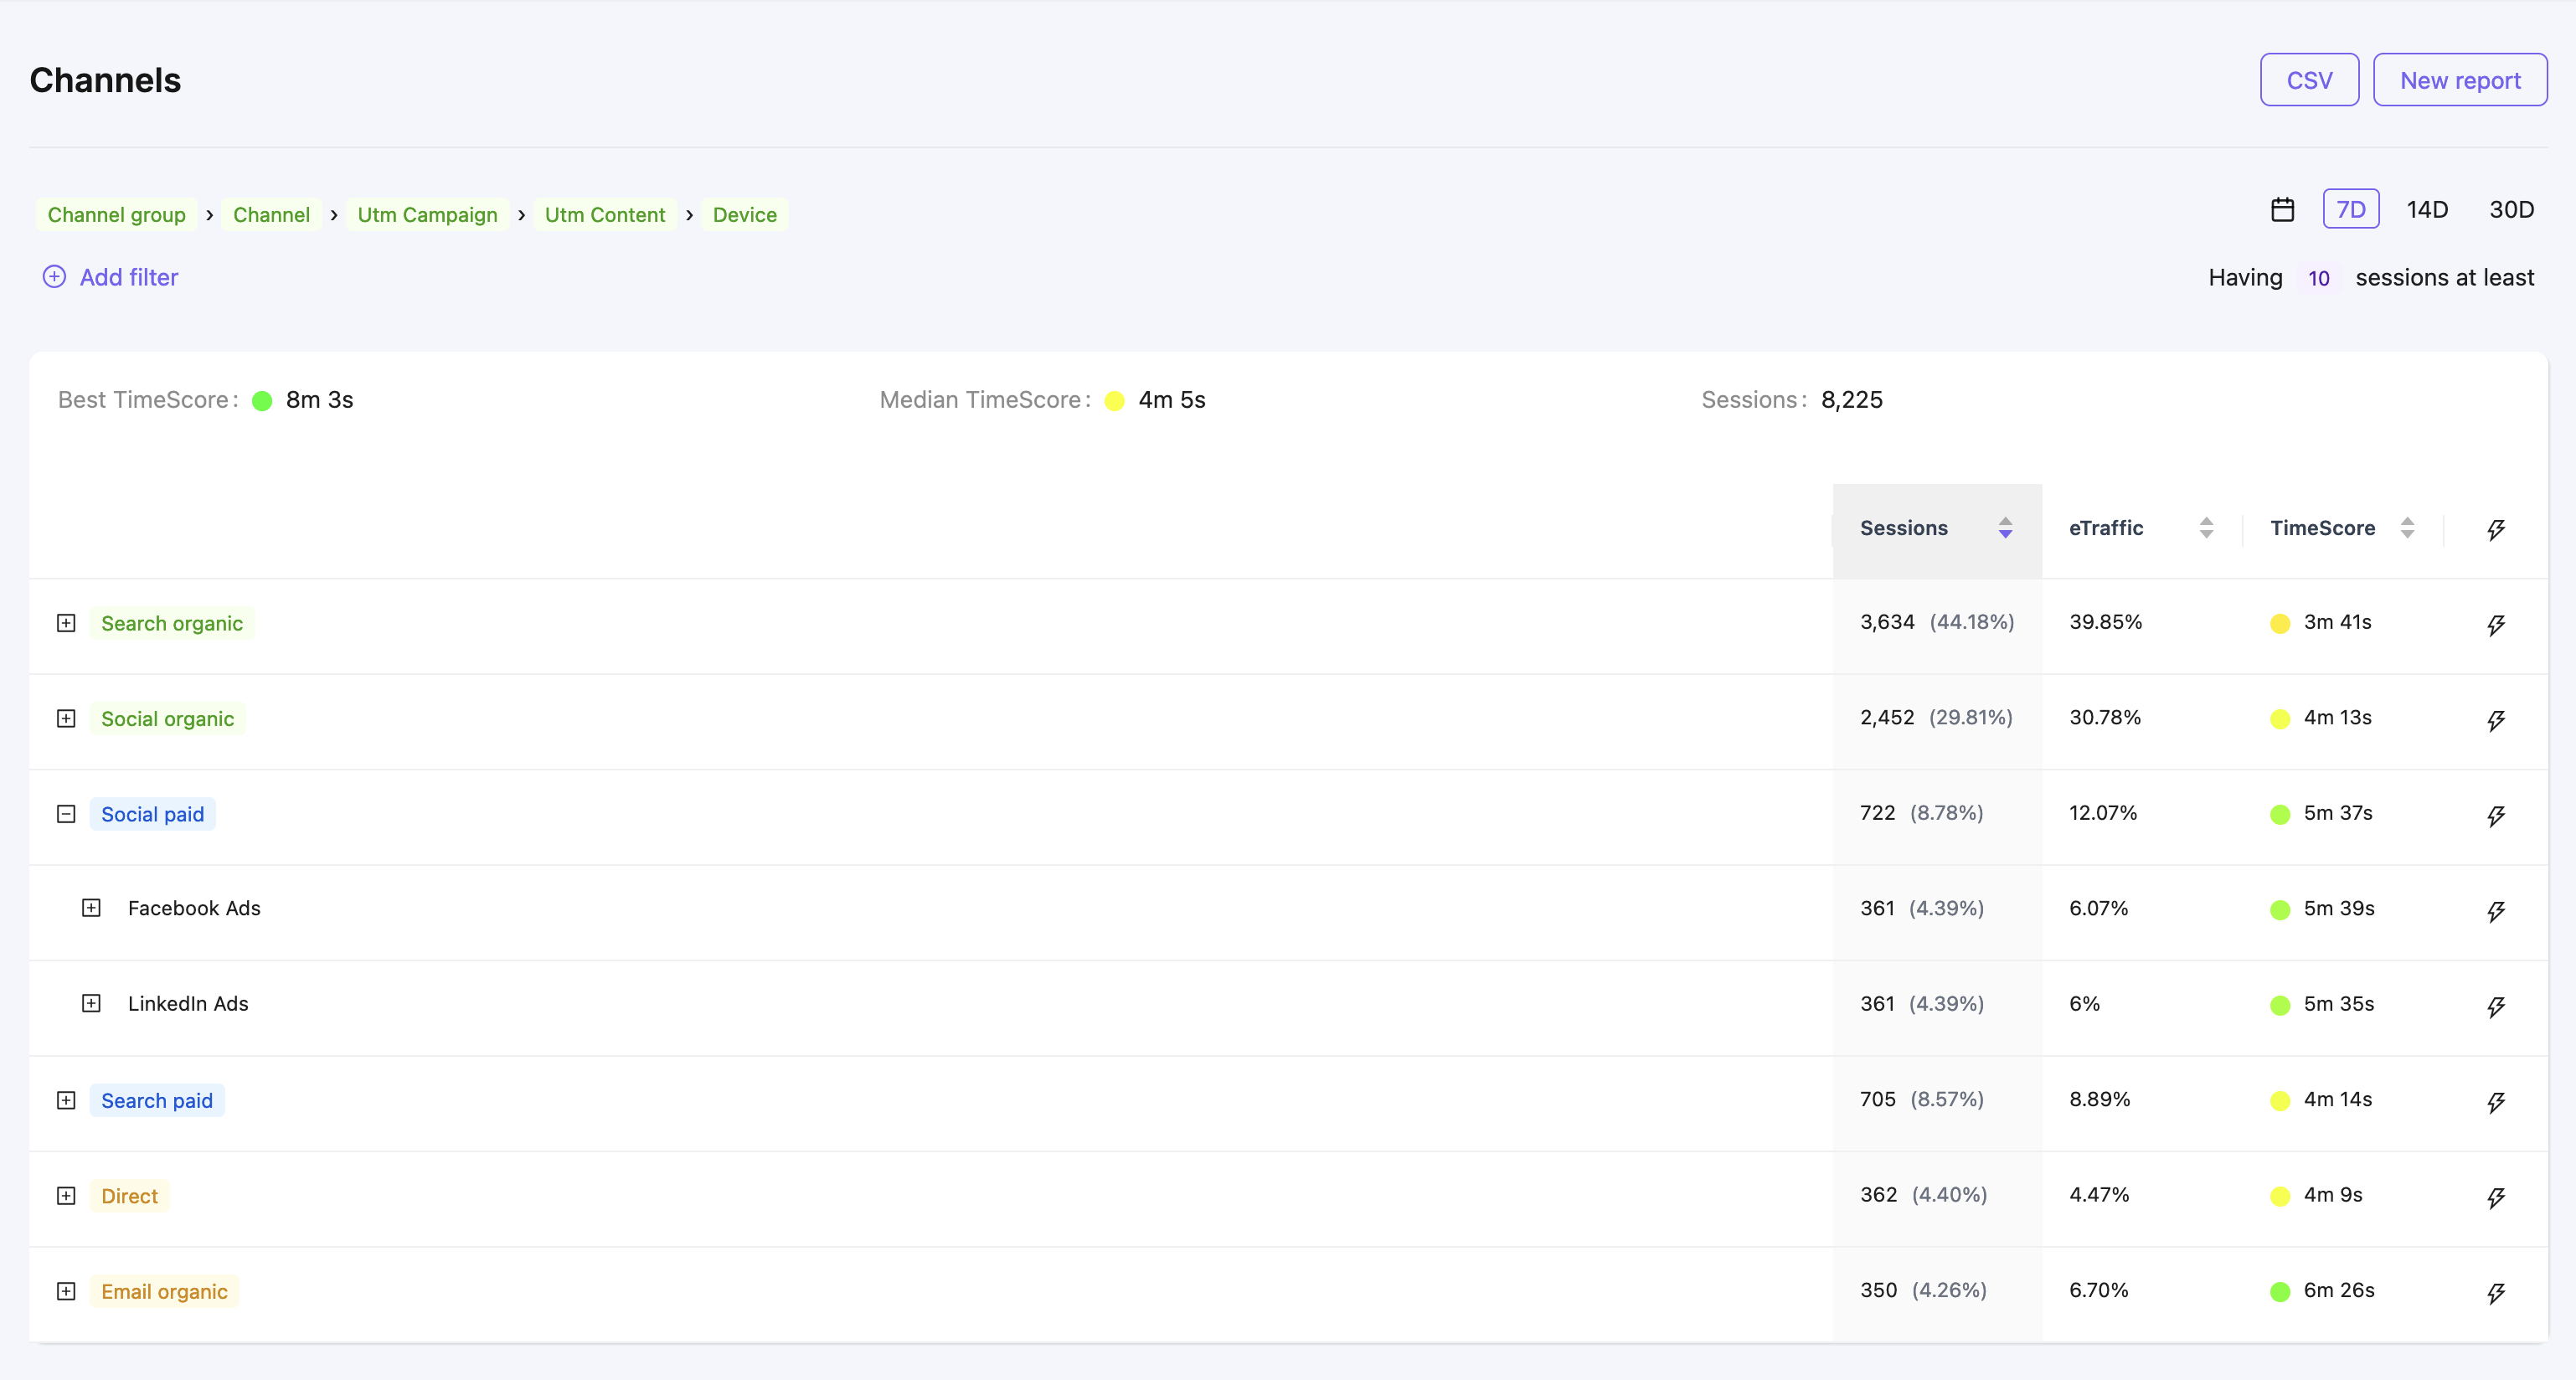
Explore
The purpose of this report is to allow you to find insights by drilling down into your data to spot the origins of the highest TimeScores, examples:- Identify new sources of traffic with top TimeScores
- Detect which landing pages have the best impact on the quality of your traffic for a given campaign
- Find out the traffic quality of an expensive campaign
- Find out the impact of a particular device on your traffic quality
- Compare the performance of your channels
- …


Google Ads
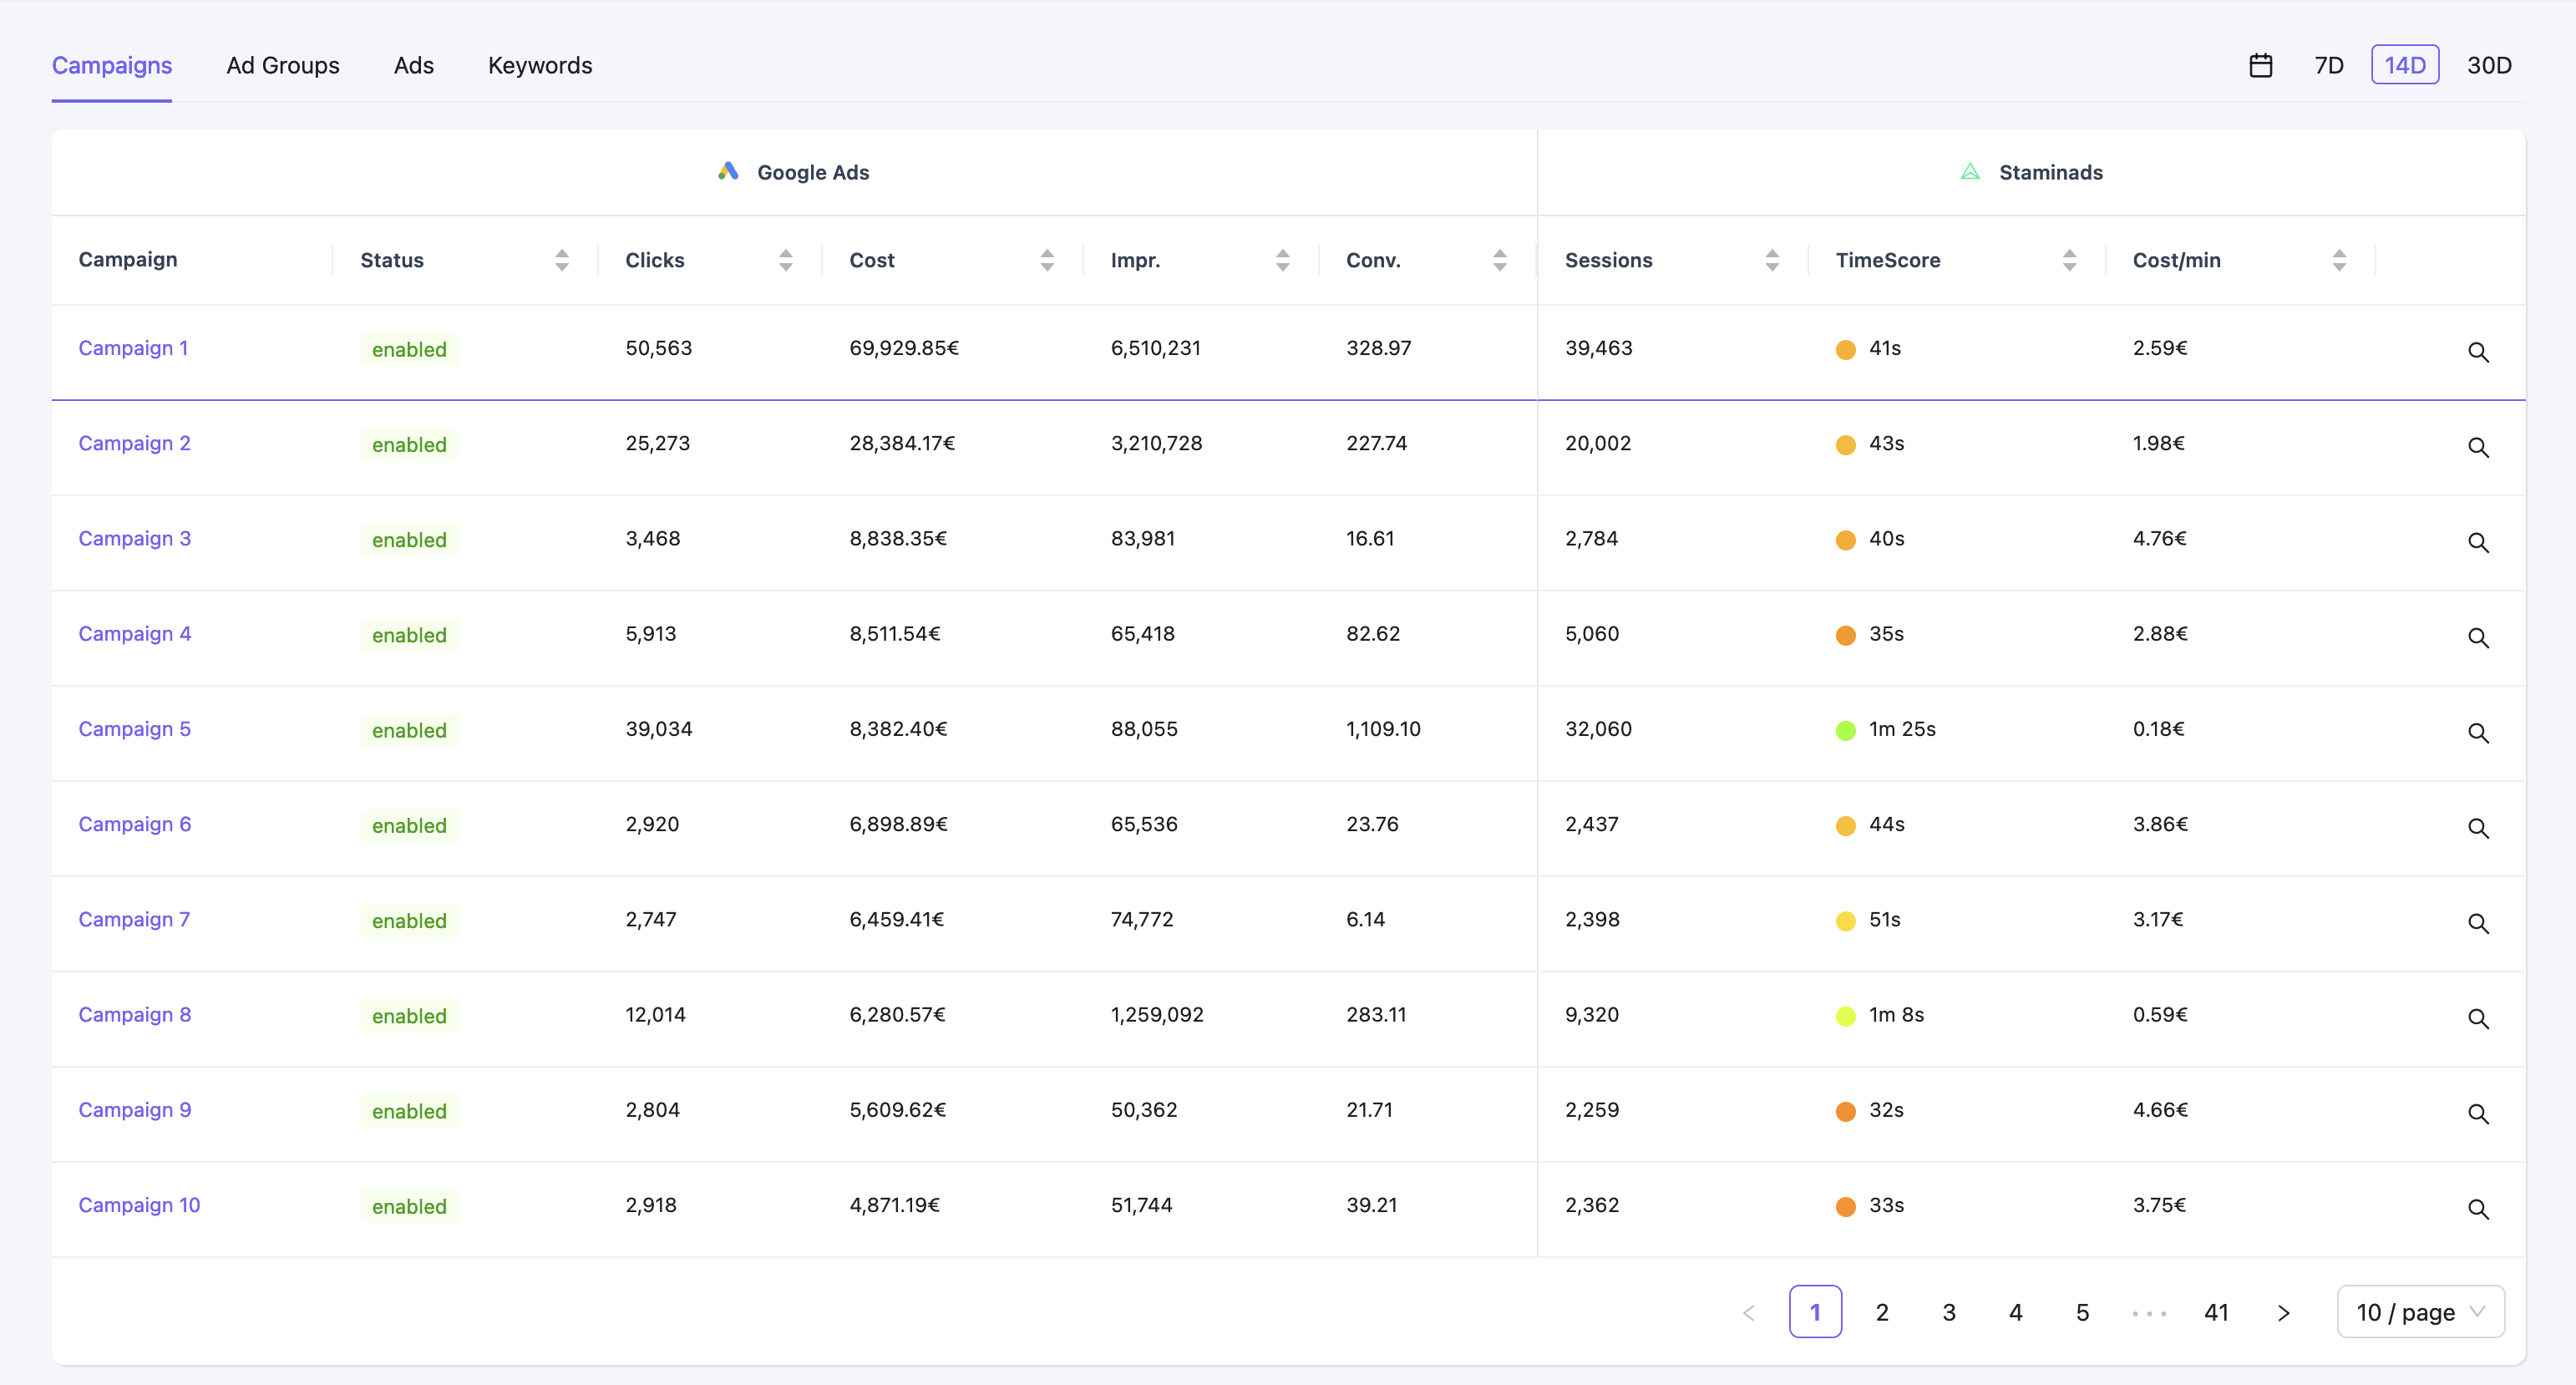
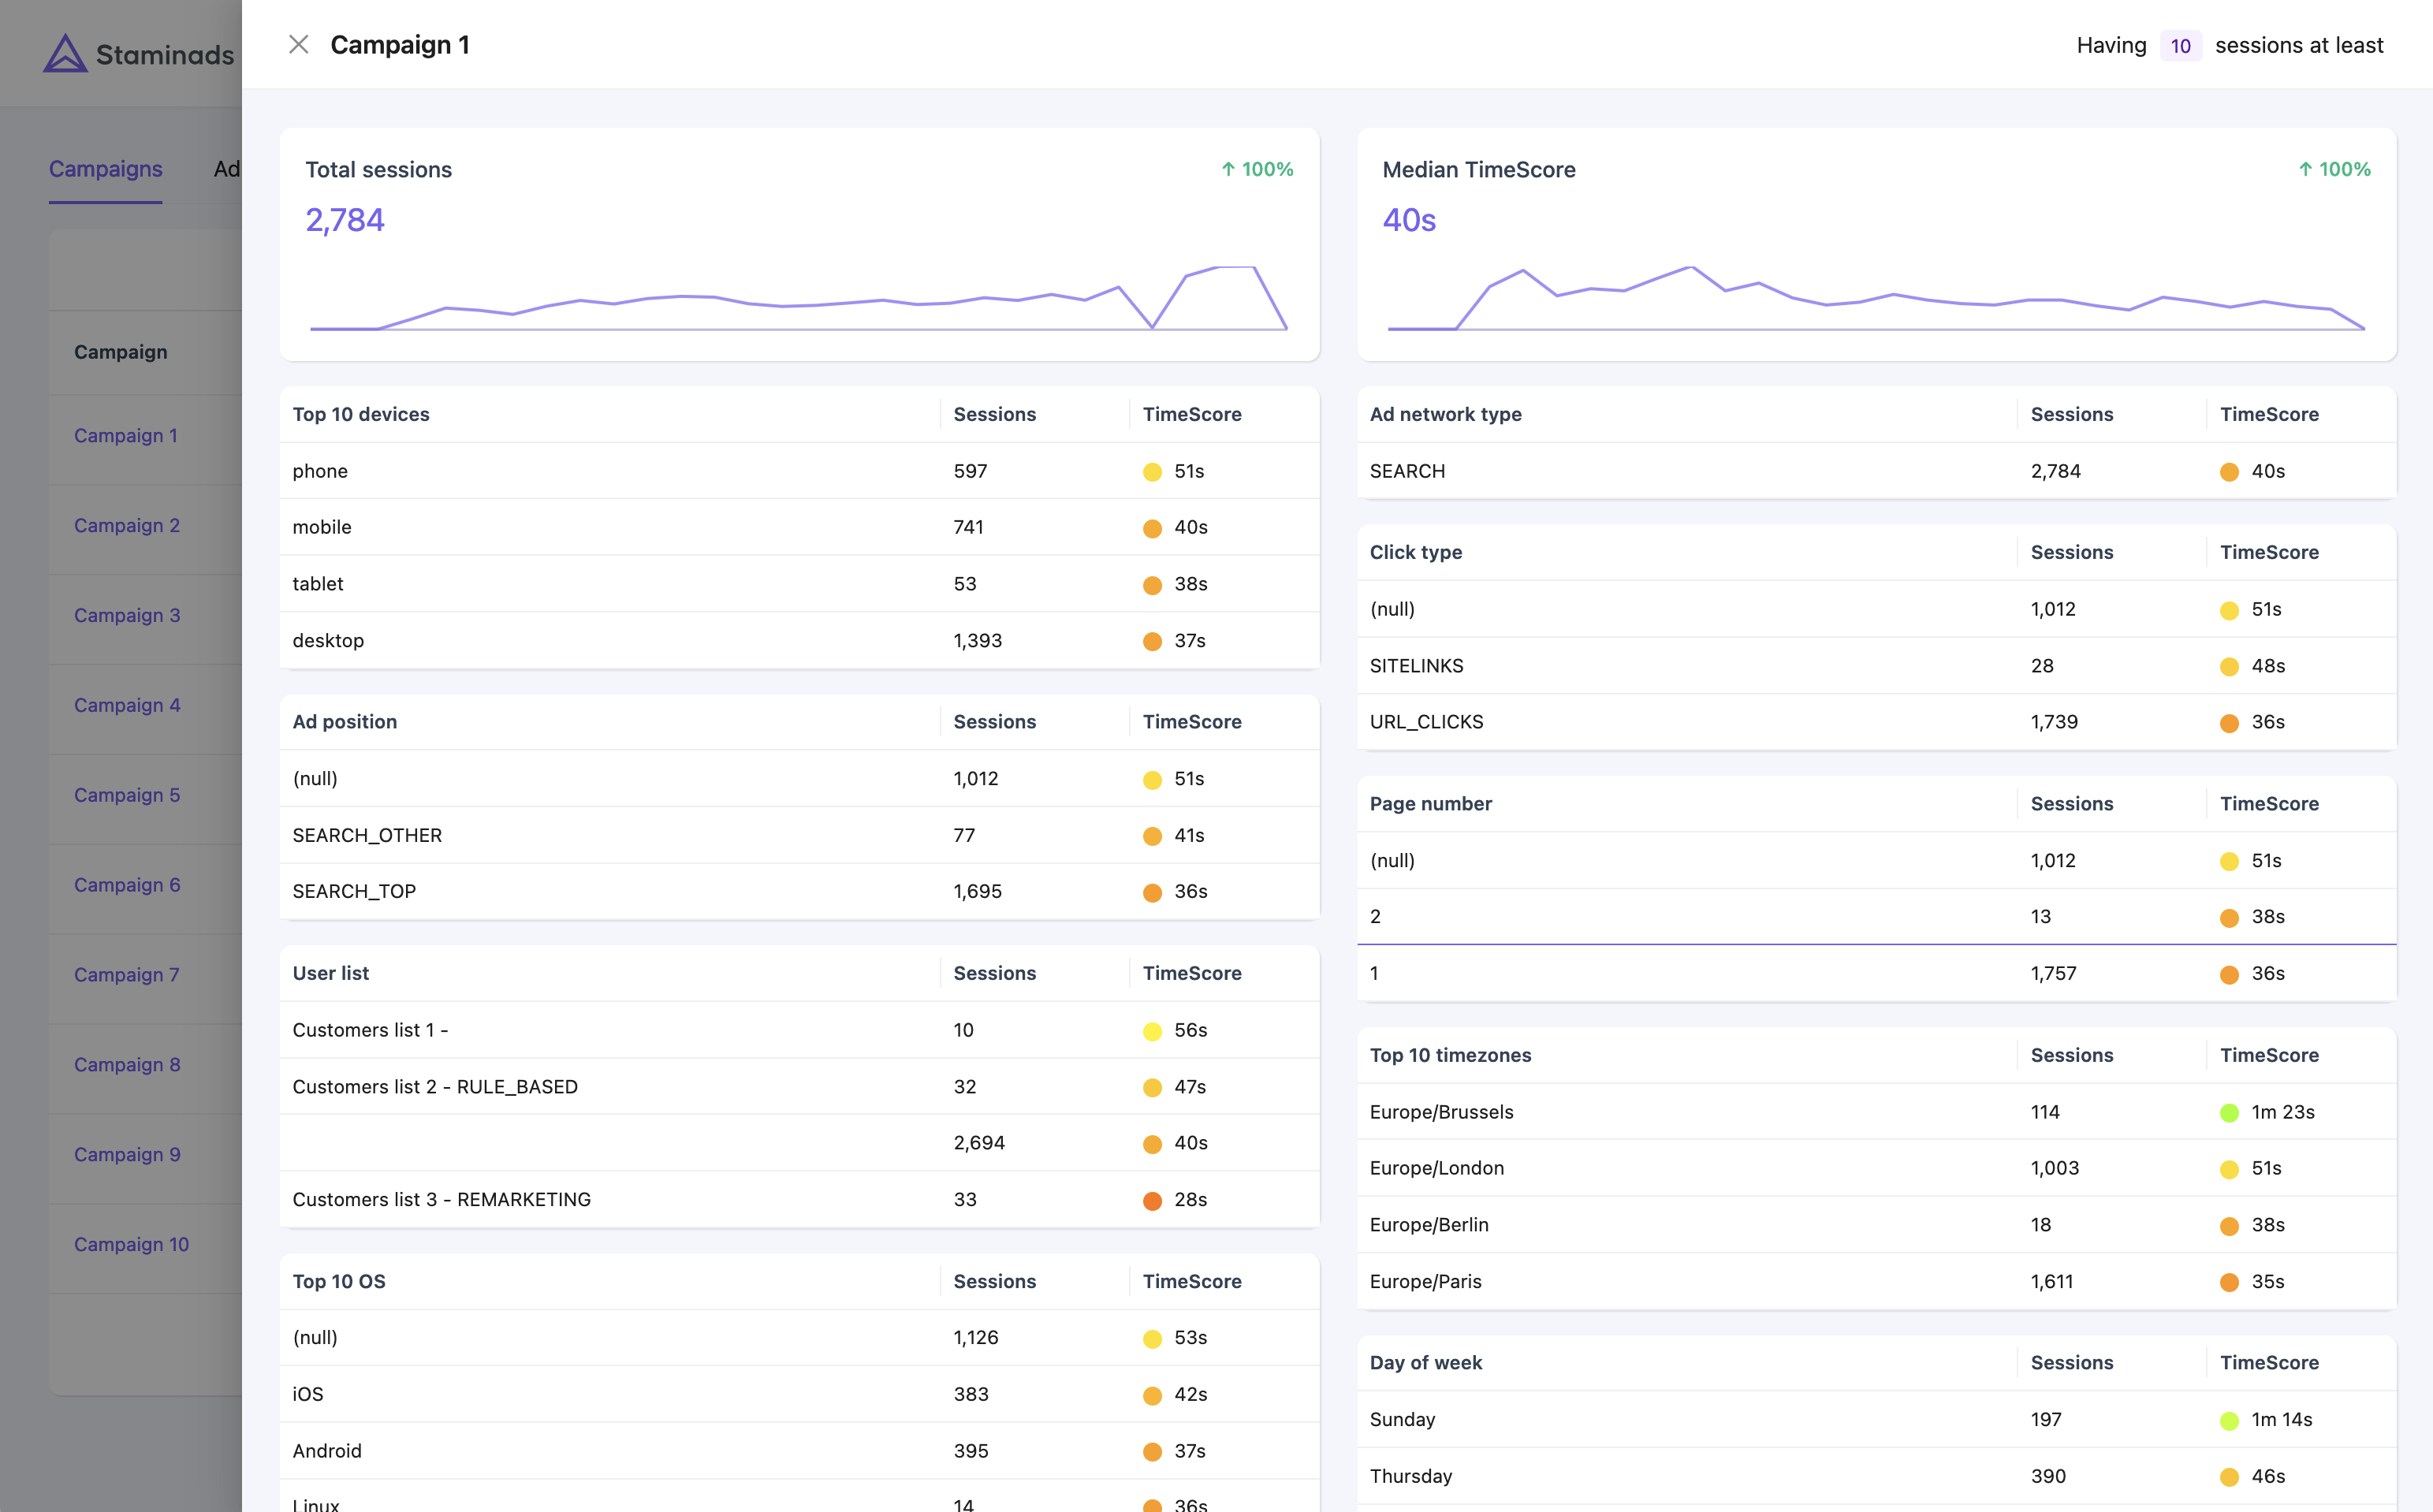
The Google Ads report blends data from your Google Ads account with Staminads TimeScores to give you insights on the performance of your campaigns, ad-groups, ads and keywords. The most important metric here is the Staminads “Cost per minute”, which replaces the ROAS metric. At the campaign level, you can get deeper insights by:- Device
- Ad network type
- Ad position
- Click type (site links, url, image, product…)
- User list (CRM remarketing)
- OS
- Results page number
- Timezone
- Day of the week
- Hour of the day
- Landing-page
- Keywords


