> ## Documentation Index
> Fetch the complete documentation index at: https://docs.staminads.com/llms.txt
> Use this file to discover all available pages before exploring further.
# Goals
> Track conversions and measure the value of your traffic
Goals allow you to track conversions and measure the business value of your traffic. Each goal can have an optional monetary value, helping you understand which traffic sources, campaigns, and pages drive the most value.
 ## Goal Cards
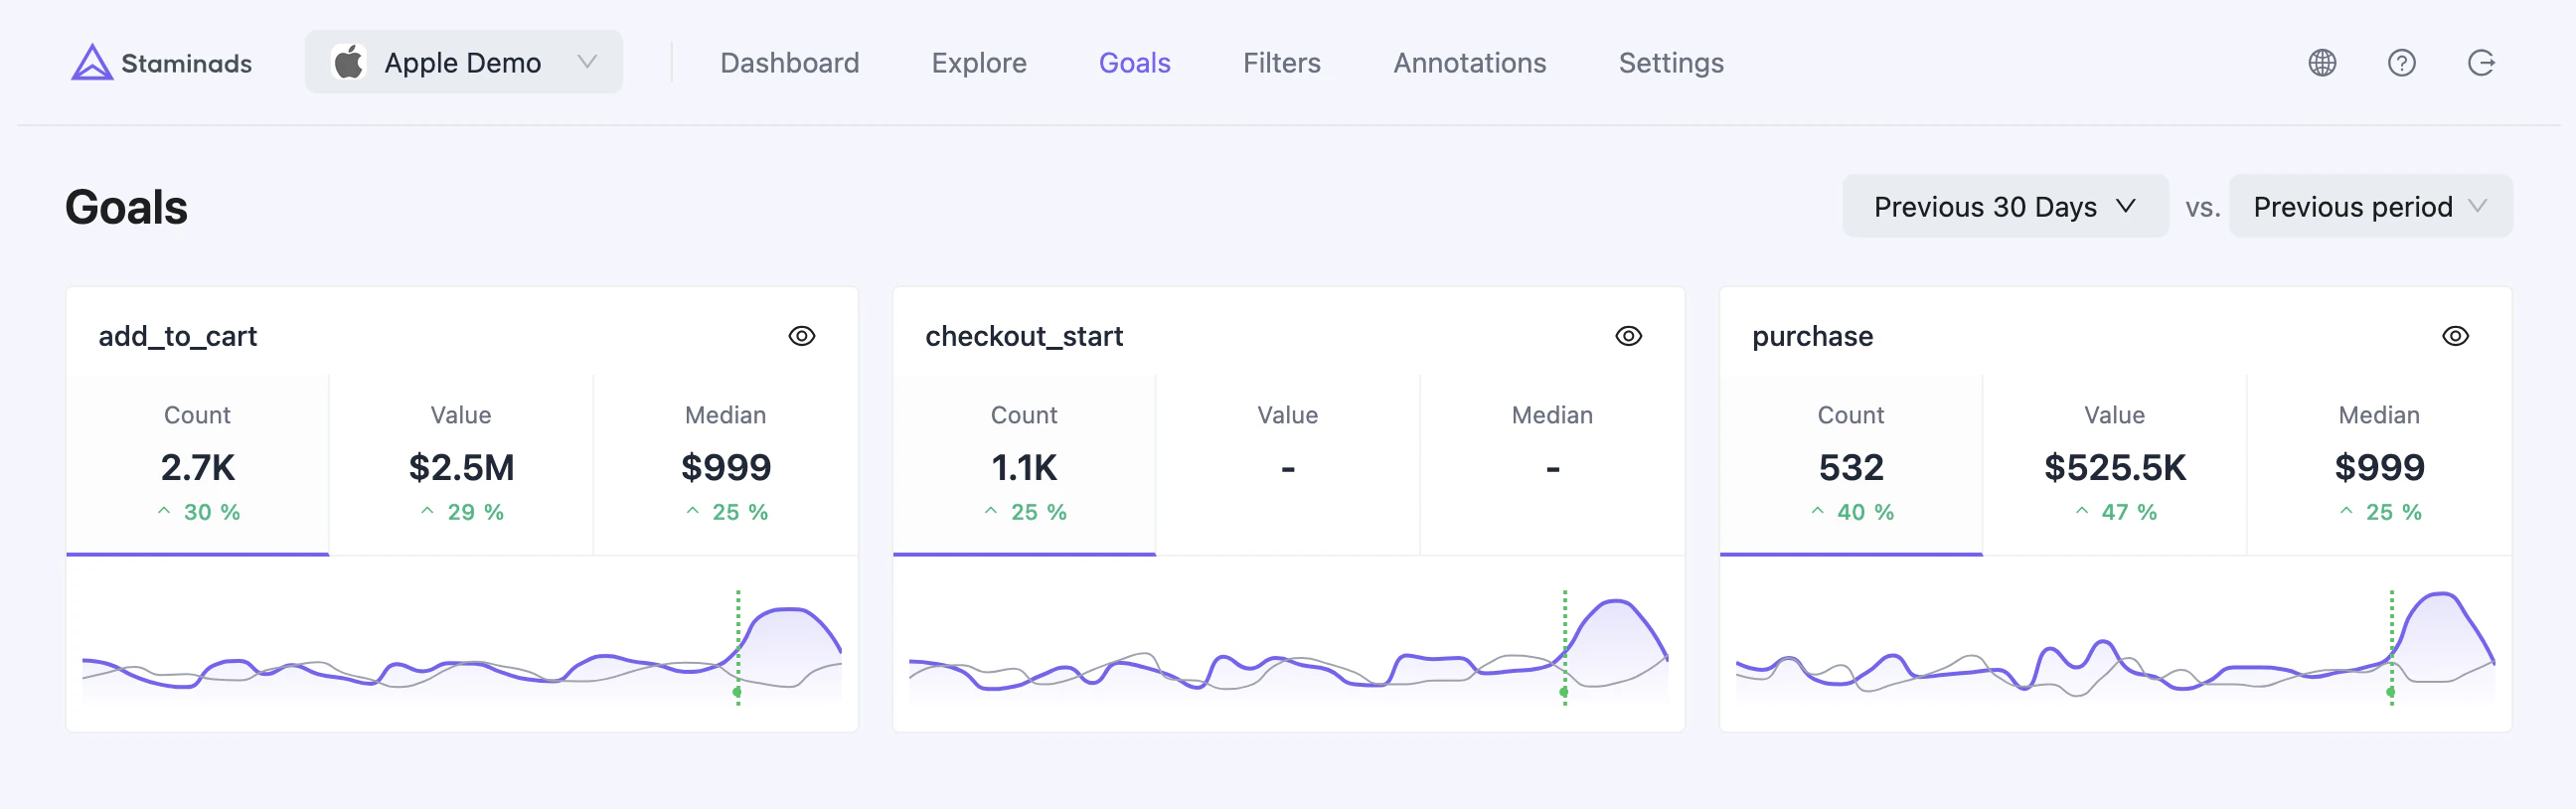
Each goal is displayed as a card with three key metrics:
| Metric | Description |
| ---------- | --------------------------------------------------------------------- |
| **Count** | Total number of times the goal was triggered |
| **Value** | Sum of all goal values (if values are tracked) |
| **Median** | Median goal value — useful for understanding typical conversion value |
Click any metric to switch the mini chart to display that metric's evolution over time.
When comparison mode is enabled, each metric shows the percentage change compared to the previous period.
## Date Range & Comparison
Use the date picker to select a time period for analysis. Enable **comparison mode** to see how your goals are performing compared to the previous period.
The mini charts on each card will show both the current period (purple line) and the previous period (gray line) when comparison is enabled.
## Goal Dashboard
Click the eye icon on any goal card to open the full goal dashboard drawer.
## Goal Cards
Each goal is displayed as a card with three key metrics:
| Metric | Description |
| ---------- | --------------------------------------------------------------------- |
| **Count** | Total number of times the goal was triggered |
| **Value** | Sum of all goal values (if values are tracked) |
| **Median** | Median goal value — useful for understanding typical conversion value |
Click any metric to switch the mini chart to display that metric's evolution over time.
When comparison mode is enabled, each metric shows the percentage change compared to the previous period.
## Date Range & Comparison
Use the date picker to select a time period for analysis. Enable **comparison mode** to see how your goals are performing compared to the previous period.
The mini charts on each card will show both the current period (purple line) and the previous period (gray line) when comparison is enabled.
## Goal Dashboard
Click the eye icon on any goal card to open the full goal dashboard drawer.
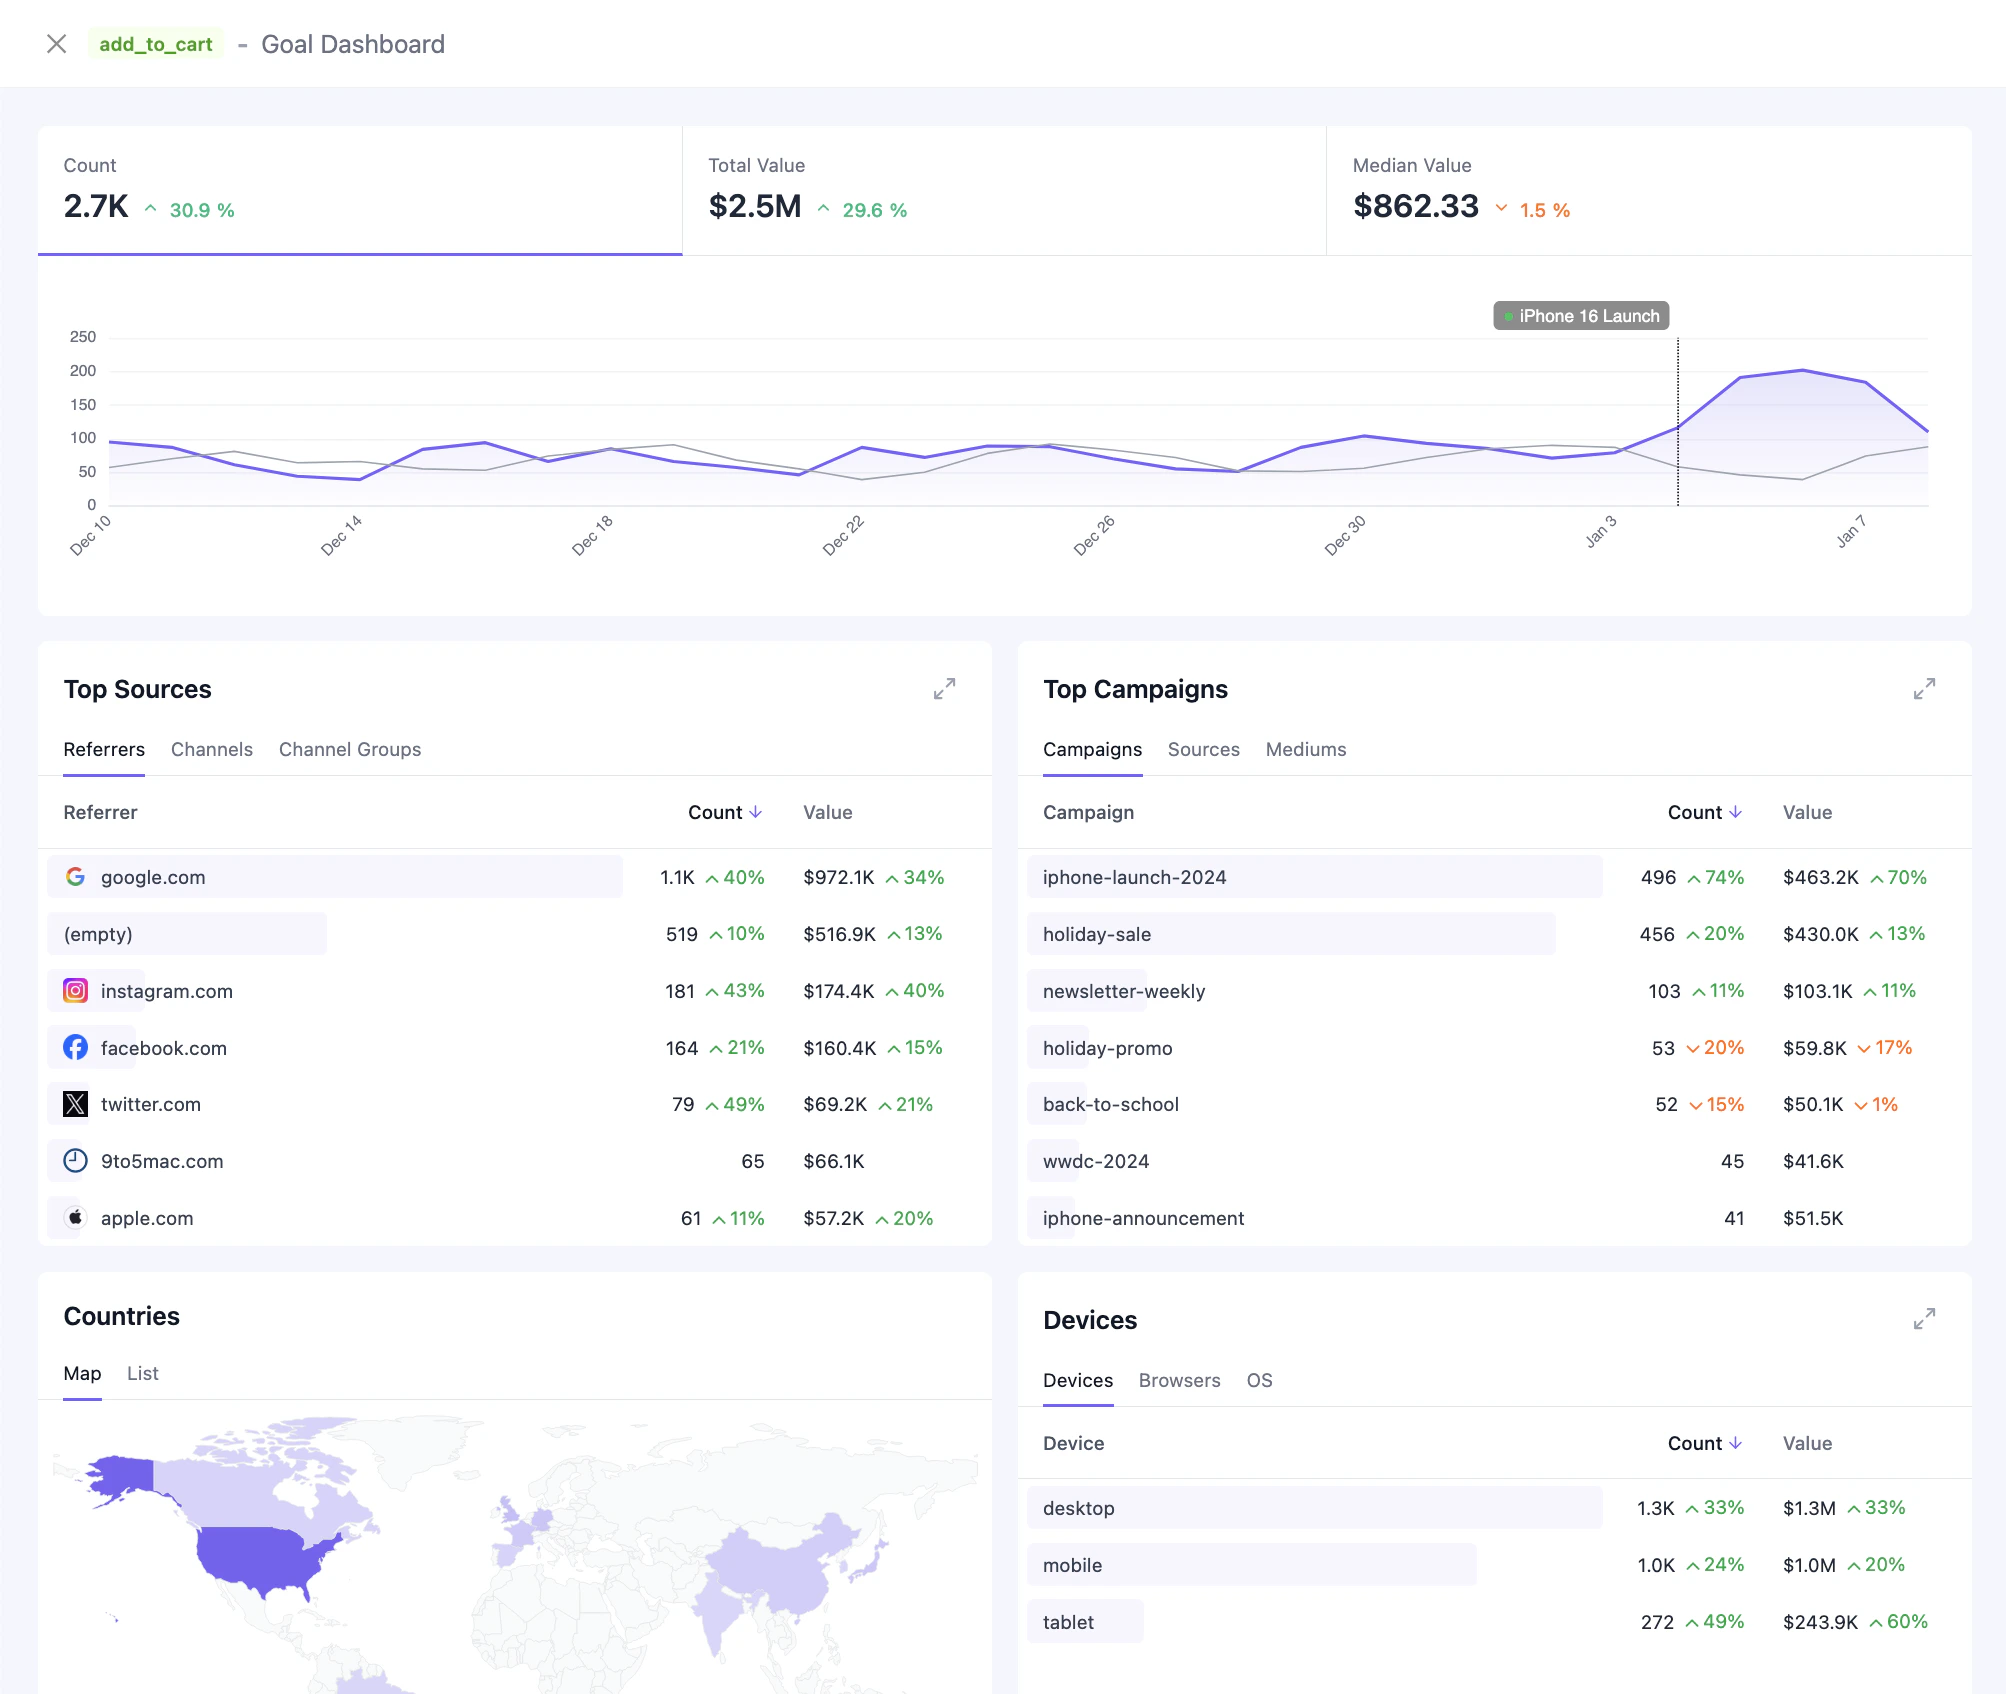 The goal dashboard provides detailed analysis for a specific goal:
### KPI Summary
The top section displays the three main metrics (Count, Value, Median) with comparison percentages. Click any metric to view its time-series chart.
### Time-Series Chart
Visualize the selected metric over time with:
* **Granularity** based on date range (hourly, daily, weekly, monthly)
* **Period comparison** overlay when comparison mode is enabled
* **Annotations** showing significant events you've marked
### Breakdown Widgets
| Widget | Tabs | Description |
| ----------------- | ----------------------------------- | -------------------------------------------- |
| **Top Sources** | Referrers, Channels, Channel groups | Which traffic sources drive conversions |
| **Top Campaigns** | Campaigns, Sources, Mediums | UTM parameter breakdown for goal conversions |
| **Countries** | Map, List | Geographic distribution of conversions |
| **Devices** | Devices, Browsers, OS | Technical breakdown of converting visitors |
| **Heatmap** | Goals | Conversion patterns by day of week and hour |
## Tracking Goals
Goals are tracked using the Web SDK. See the [Web SDK documentation](/web-sdk#tracking-goals) for implementation details.
```javascript theme={null}
// Track a goal without value
staminads.goal('signup')
// Track a goal with a value
staminads.goal('purchase', 99.99)
```
Use meaningful goal names that describe the conversion action, such as `signup`, `purchase`, `newsletter_subscribe`, or `contact_form_submit`.
The goal dashboard provides detailed analysis for a specific goal:
### KPI Summary
The top section displays the three main metrics (Count, Value, Median) with comparison percentages. Click any metric to view its time-series chart.
### Time-Series Chart
Visualize the selected metric over time with:
* **Granularity** based on date range (hourly, daily, weekly, monthly)
* **Period comparison** overlay when comparison mode is enabled
* **Annotations** showing significant events you've marked
### Breakdown Widgets
| Widget | Tabs | Description |
| ----------------- | ----------------------------------- | -------------------------------------------- |
| **Top Sources** | Referrers, Channels, Channel groups | Which traffic sources drive conversions |
| **Top Campaigns** | Campaigns, Sources, Mediums | UTM parameter breakdown for goal conversions |
| **Countries** | Map, List | Geographic distribution of conversions |
| **Devices** | Devices, Browsers, OS | Technical breakdown of converting visitors |
| **Heatmap** | Goals | Conversion patterns by day of week and hour |
## Tracking Goals
Goals are tracked using the Web SDK. See the [Web SDK documentation](/web-sdk#tracking-goals) for implementation details.
```javascript theme={null}
// Track a goal without value
staminads.goal('signup')
// Track a goal with a value
staminads.goal('purchase', 99.99)
```
Use meaningful goal names that describe the conversion action, such as `signup`, `purchase`, `newsletter_subscribe`, or `contact_form_submit`.