> ## Documentation Index
> Fetch the complete documentation index at: https://docs.staminads.com/llms.txt
> Use this file to discover all available pages before exploring further.
# Explore Report
> Deep dive into your data to find insights
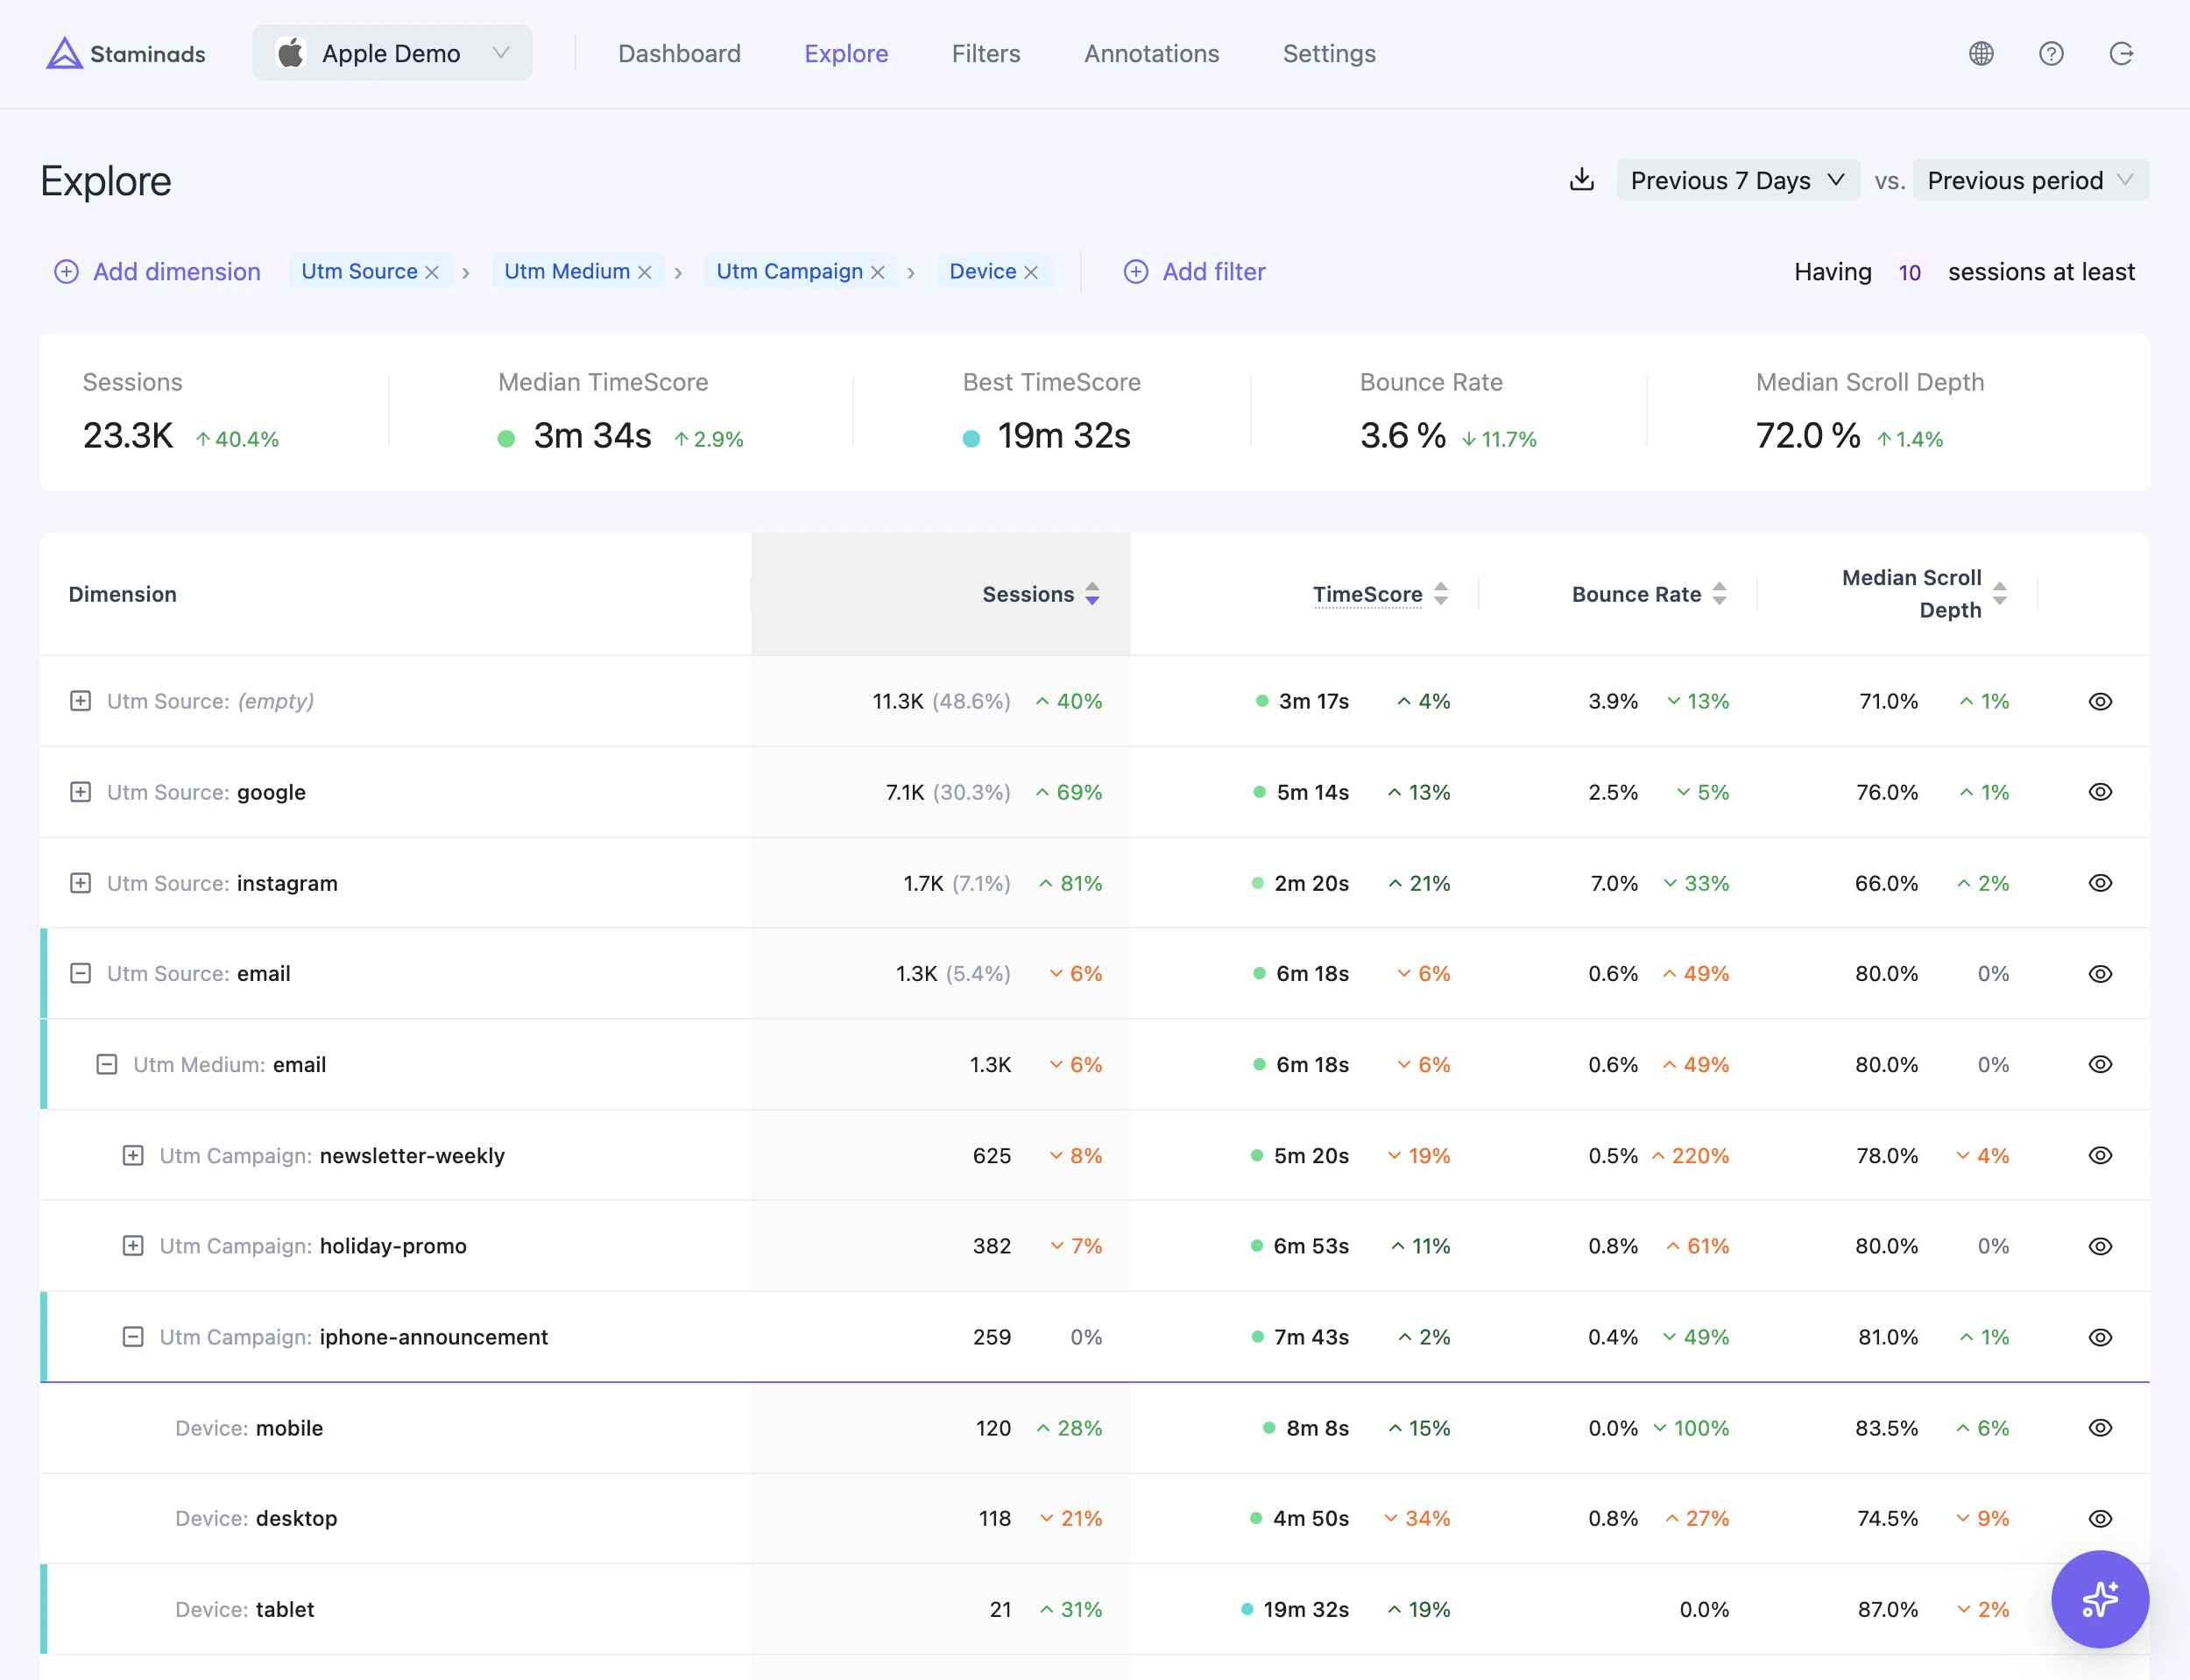
The Explore report lets you drill down into your data by any dimension to spot patterns and find insights.
 ## Use Cases
* **Find high-performing traffic sources** — Identify new sources with top TimeScores
* **Optimize landing pages** — Detect which pages have the best engagement for a given campaign
* **Audit expensive campaigns** — Measure the traffic quality of high-spend campaigns
* **Device analysis** — Find out the impact of device types on engagement
* **Channel comparison** — Compare TimeScores across your marketing channels
## How It Works
1. **Select dimensions** — Choose what to group by (source, landing page, device, etc.)
2. **Apply filters** — Narrow down to specific traffic segments
3. **Sort by metrics** — Order by sessions, TimeScore, bounce rate, etc.
4. **Drill down** — Click any row to add it as a filter and explore deeper
## Use Cases
* **Find high-performing traffic sources** — Identify new sources with top TimeScores
* **Optimize landing pages** — Detect which pages have the best engagement for a given campaign
* **Audit expensive campaigns** — Measure the traffic quality of high-spend campaigns
* **Device analysis** — Find out the impact of device types on engagement
* **Channel comparison** — Compare TimeScores across your marketing channels
## How It Works
1. **Select dimensions** — Choose what to group by (source, landing page, device, etc.)
2. **Apply filters** — Narrow down to specific traffic segments
3. **Sort by metrics** — Order by sessions, TimeScore, bounce rate, etc.
4. **Drill down** — Click any row to add it as a filter and explore deeper
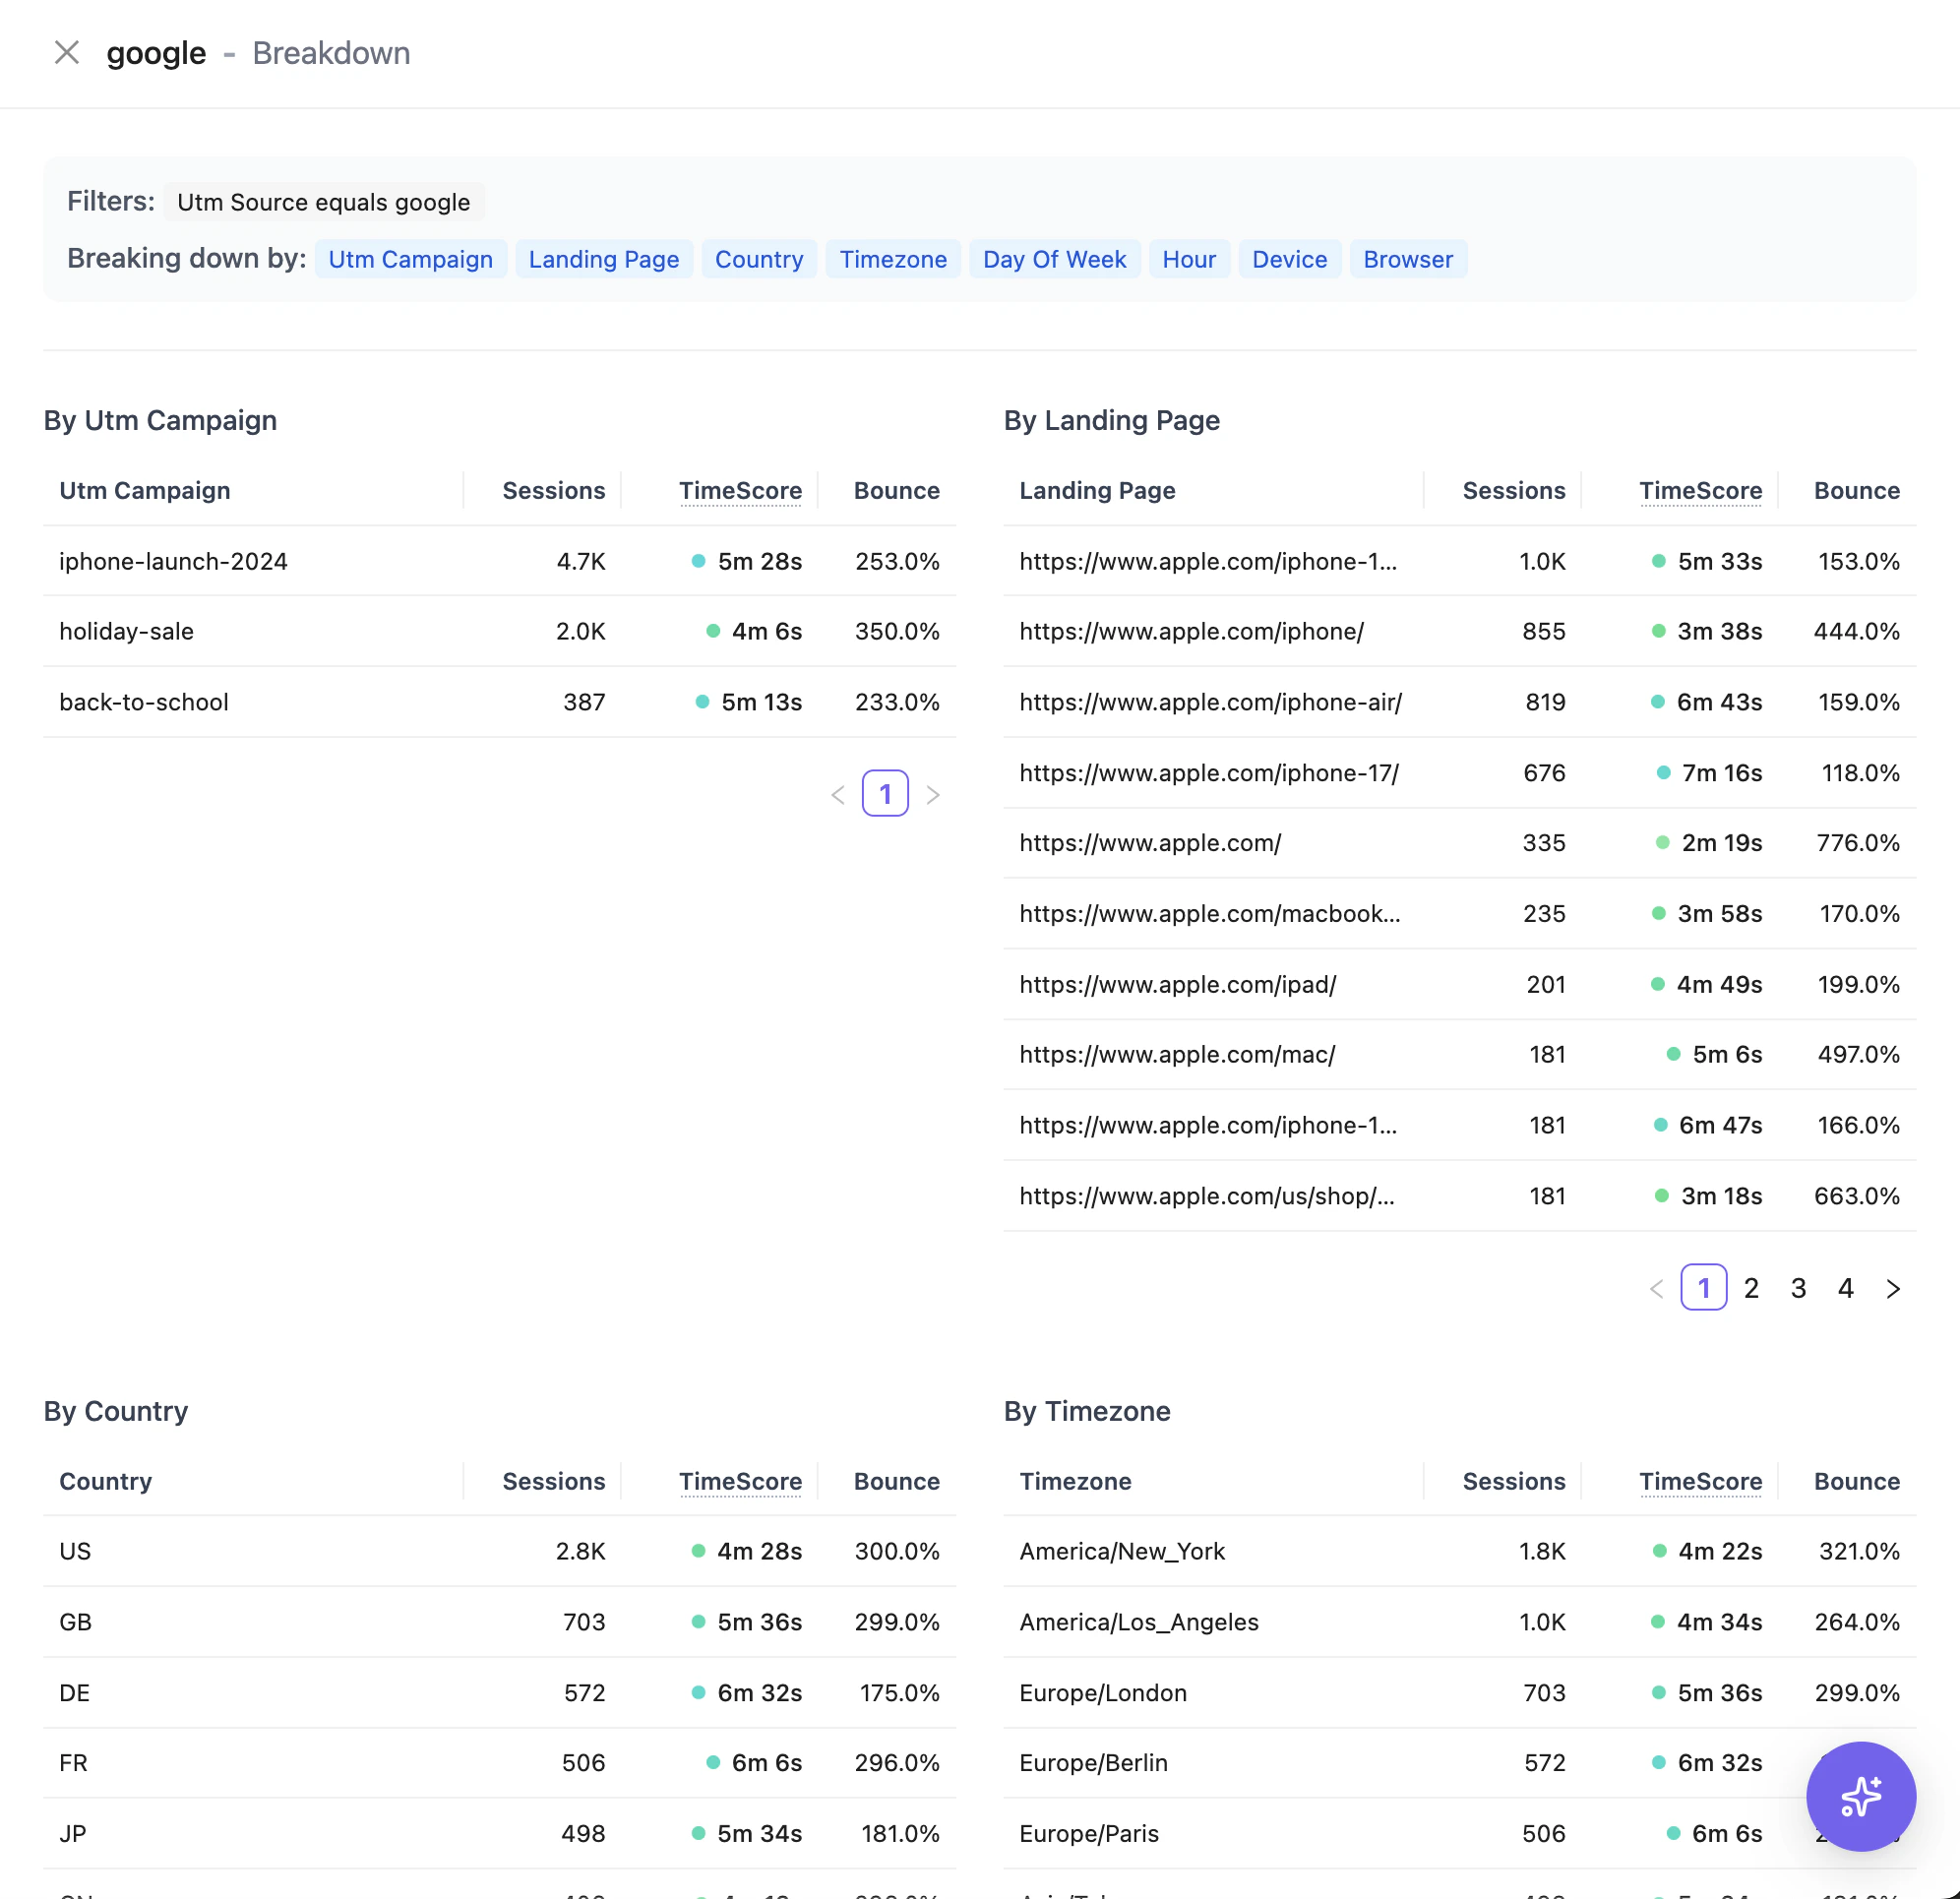 Start broad (e.g., by channel) then drill down into specific dimensions to understand what drives engagement. The best insights often come from unexpected combinations.