> ## Documentation Index
> Fetch the complete documentation index at: https://docs.staminads.com/llms.txt
> Use this file to discover all available pages before exploring further.
# Dashboard
> Monitor your traffic quality at a glance
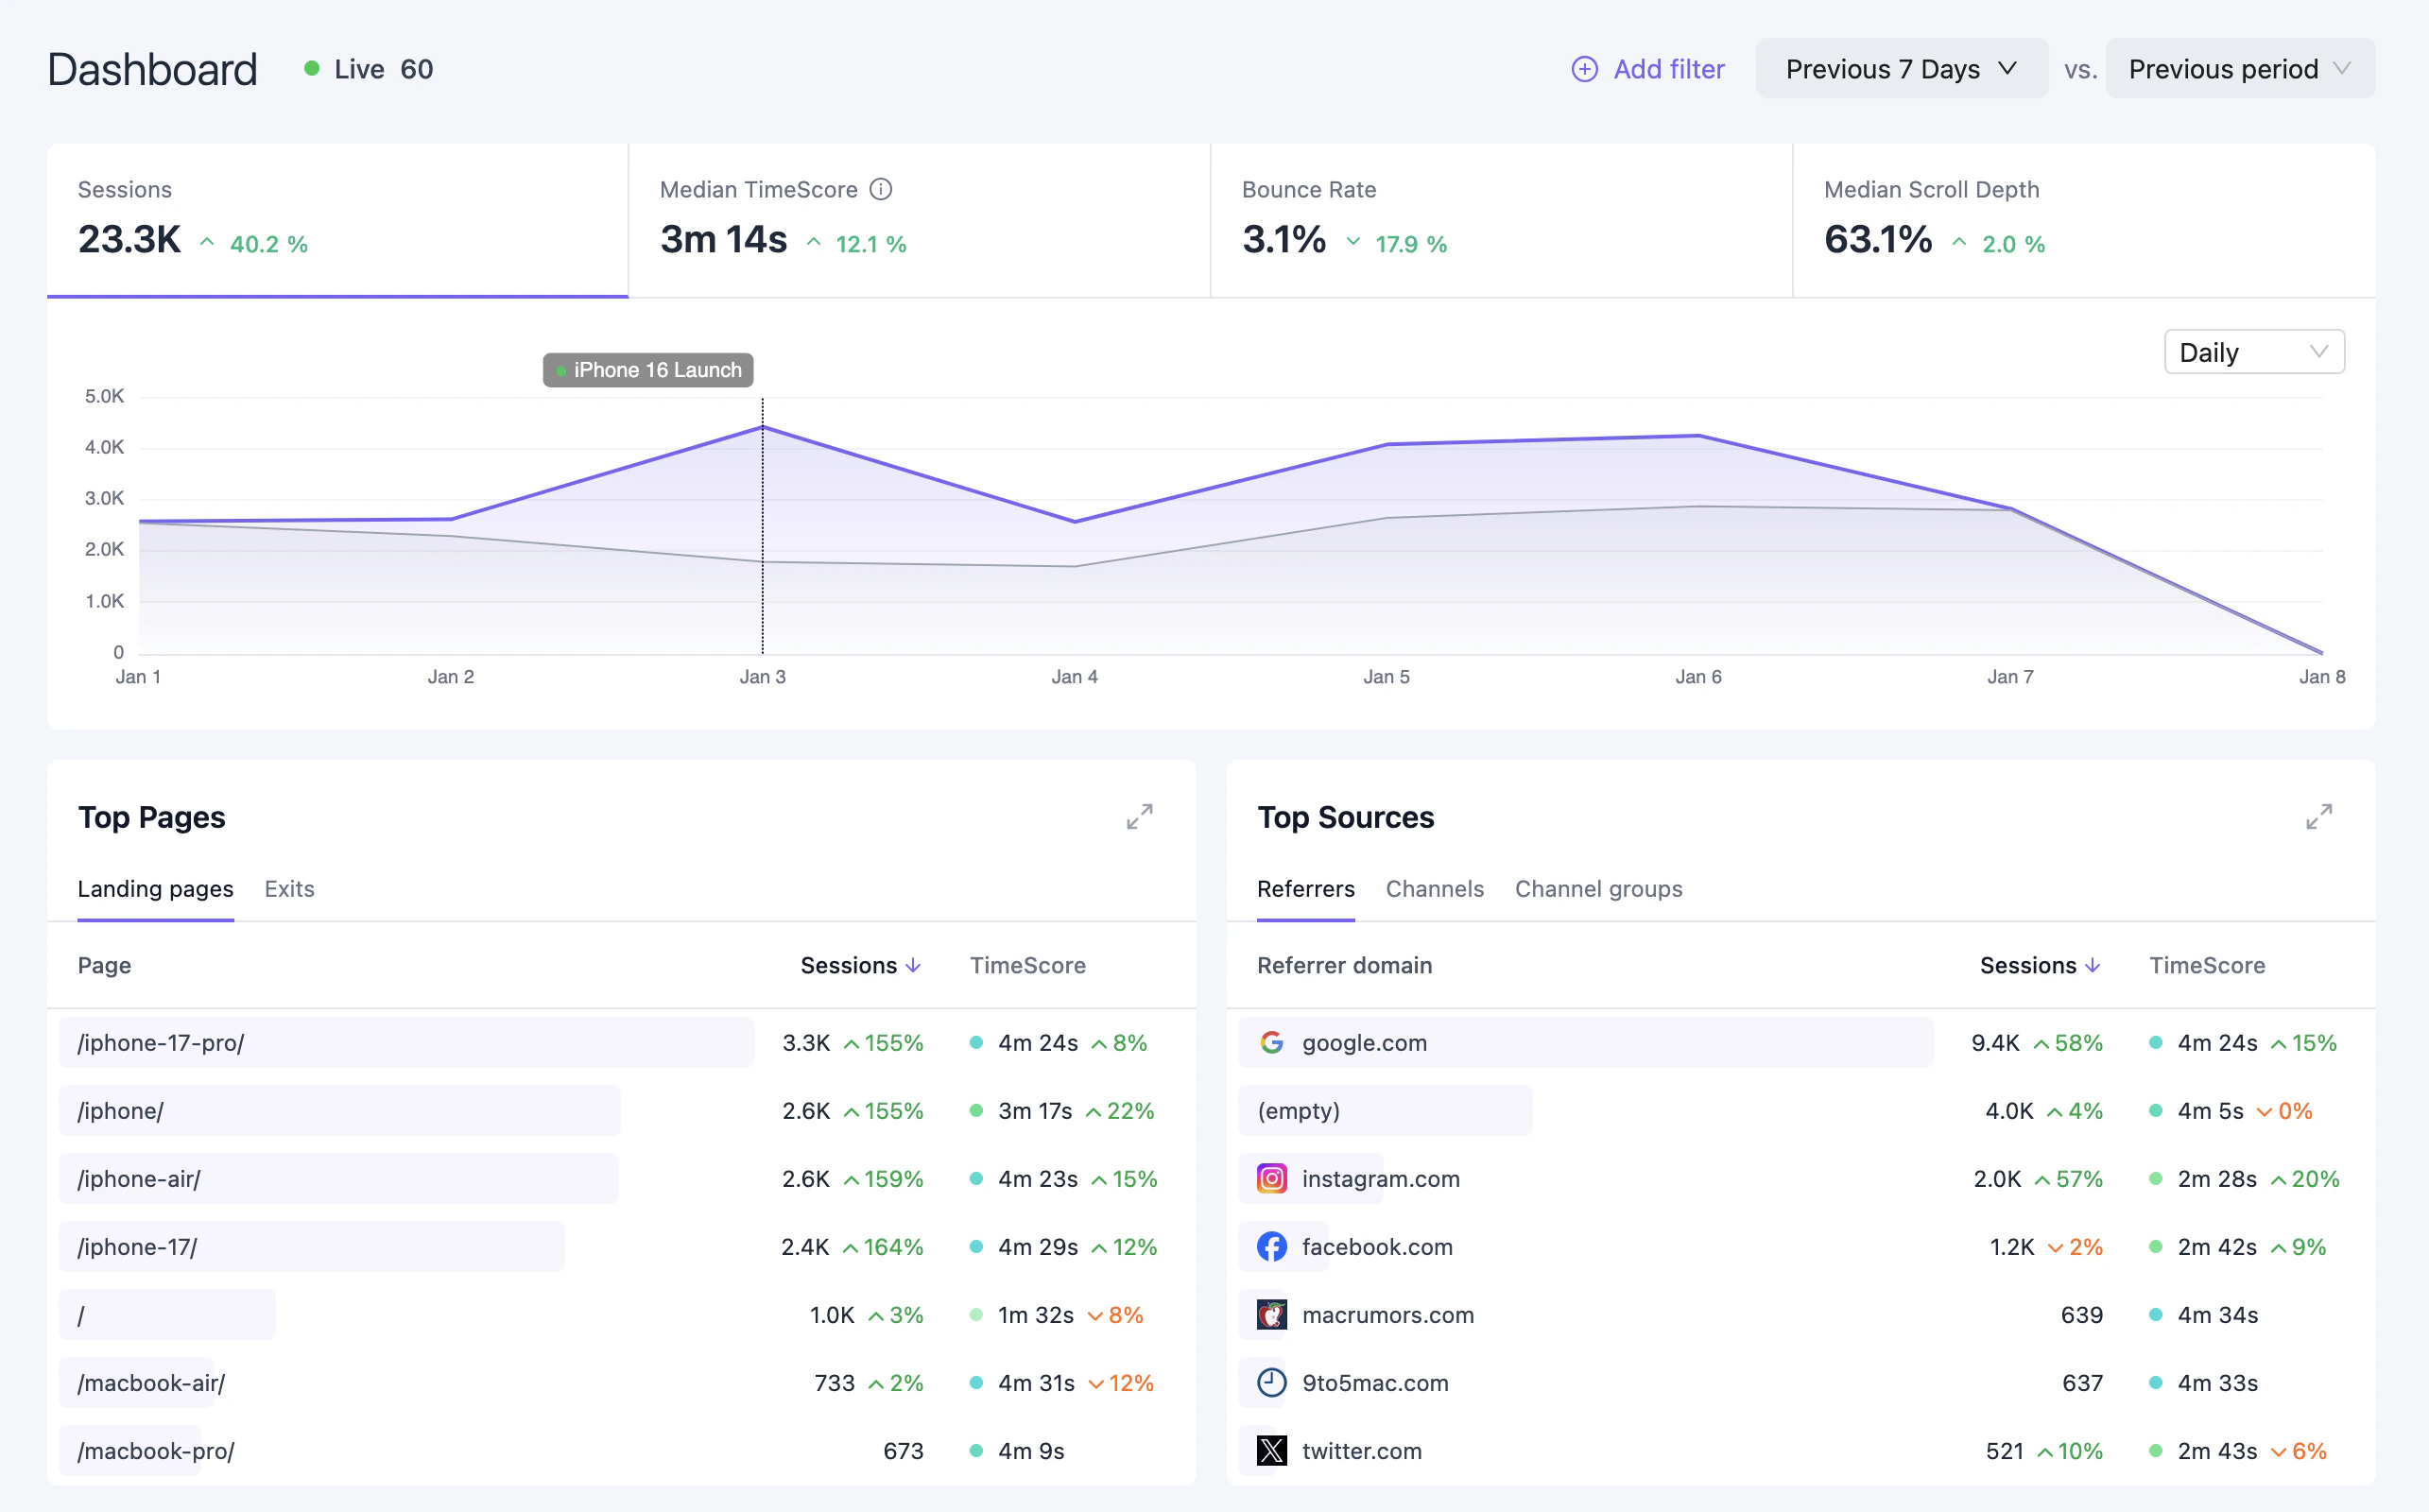
The Dashboard provides an overview of your traffic quality with key metrics, trends, and breakdowns by dimension.
 ## Date Range & Comparison
Use the date picker to select a time period for analysis. Available presets include Today, Yesterday, Last 7 days, Last 30 days, and custom ranges.
Enable **comparison mode** to overlay the previous period on charts and show percentage changes on KPIs. This helps identify trends and measure performance over time.
## Key Metrics
The top row displays your main KPIs:
| Metric | Description |
| -------------------- | ------------------------------------------------------------- |
| **Sessions** | Total number of sessions in the selected period |
| **Median TimeScore** | Median session duration — your core engagement metric |
| **Bounce Rate** | Percentage of single-page sessions below the bounce threshold |
| **Pages / Session** | Average number of pages viewed per session |
Click any metric to switch the time-series chart to that metric.
## Time-Series Chart
The main chart visualizes your selected metric over time. Features include:
* **Granularity selector** — Switch between hourly, daily, weekly, or monthly views
* **Period comparison** — Overlay previous period data when comparison mode is enabled
* **Annotations** — Vertical markers for significant events you've added
## Widgets
## Date Range & Comparison
Use the date picker to select a time period for analysis. Available presets include Today, Yesterday, Last 7 days, Last 30 days, and custom ranges.
Enable **comparison mode** to overlay the previous period on charts and show percentage changes on KPIs. This helps identify trends and measure performance over time.
## Key Metrics
The top row displays your main KPIs:
| Metric | Description |
| -------------------- | ------------------------------------------------------------- |
| **Sessions** | Total number of sessions in the selected period |
| **Median TimeScore** | Median session duration — your core engagement metric |
| **Bounce Rate** | Percentage of single-page sessions below the bounce threshold |
| **Pages / Session** | Average number of pages viewed per session |
Click any metric to switch the time-series chart to that metric.
## Time-Series Chart
The main chart visualizes your selected metric over time. Features include:
* **Granularity selector** — Switch between hourly, daily, weekly, or monthly views
* **Period comparison** — Overlay previous period data when comparison mode is enabled
* **Annotations** — Vertical markers for significant events you've added
## Widgets
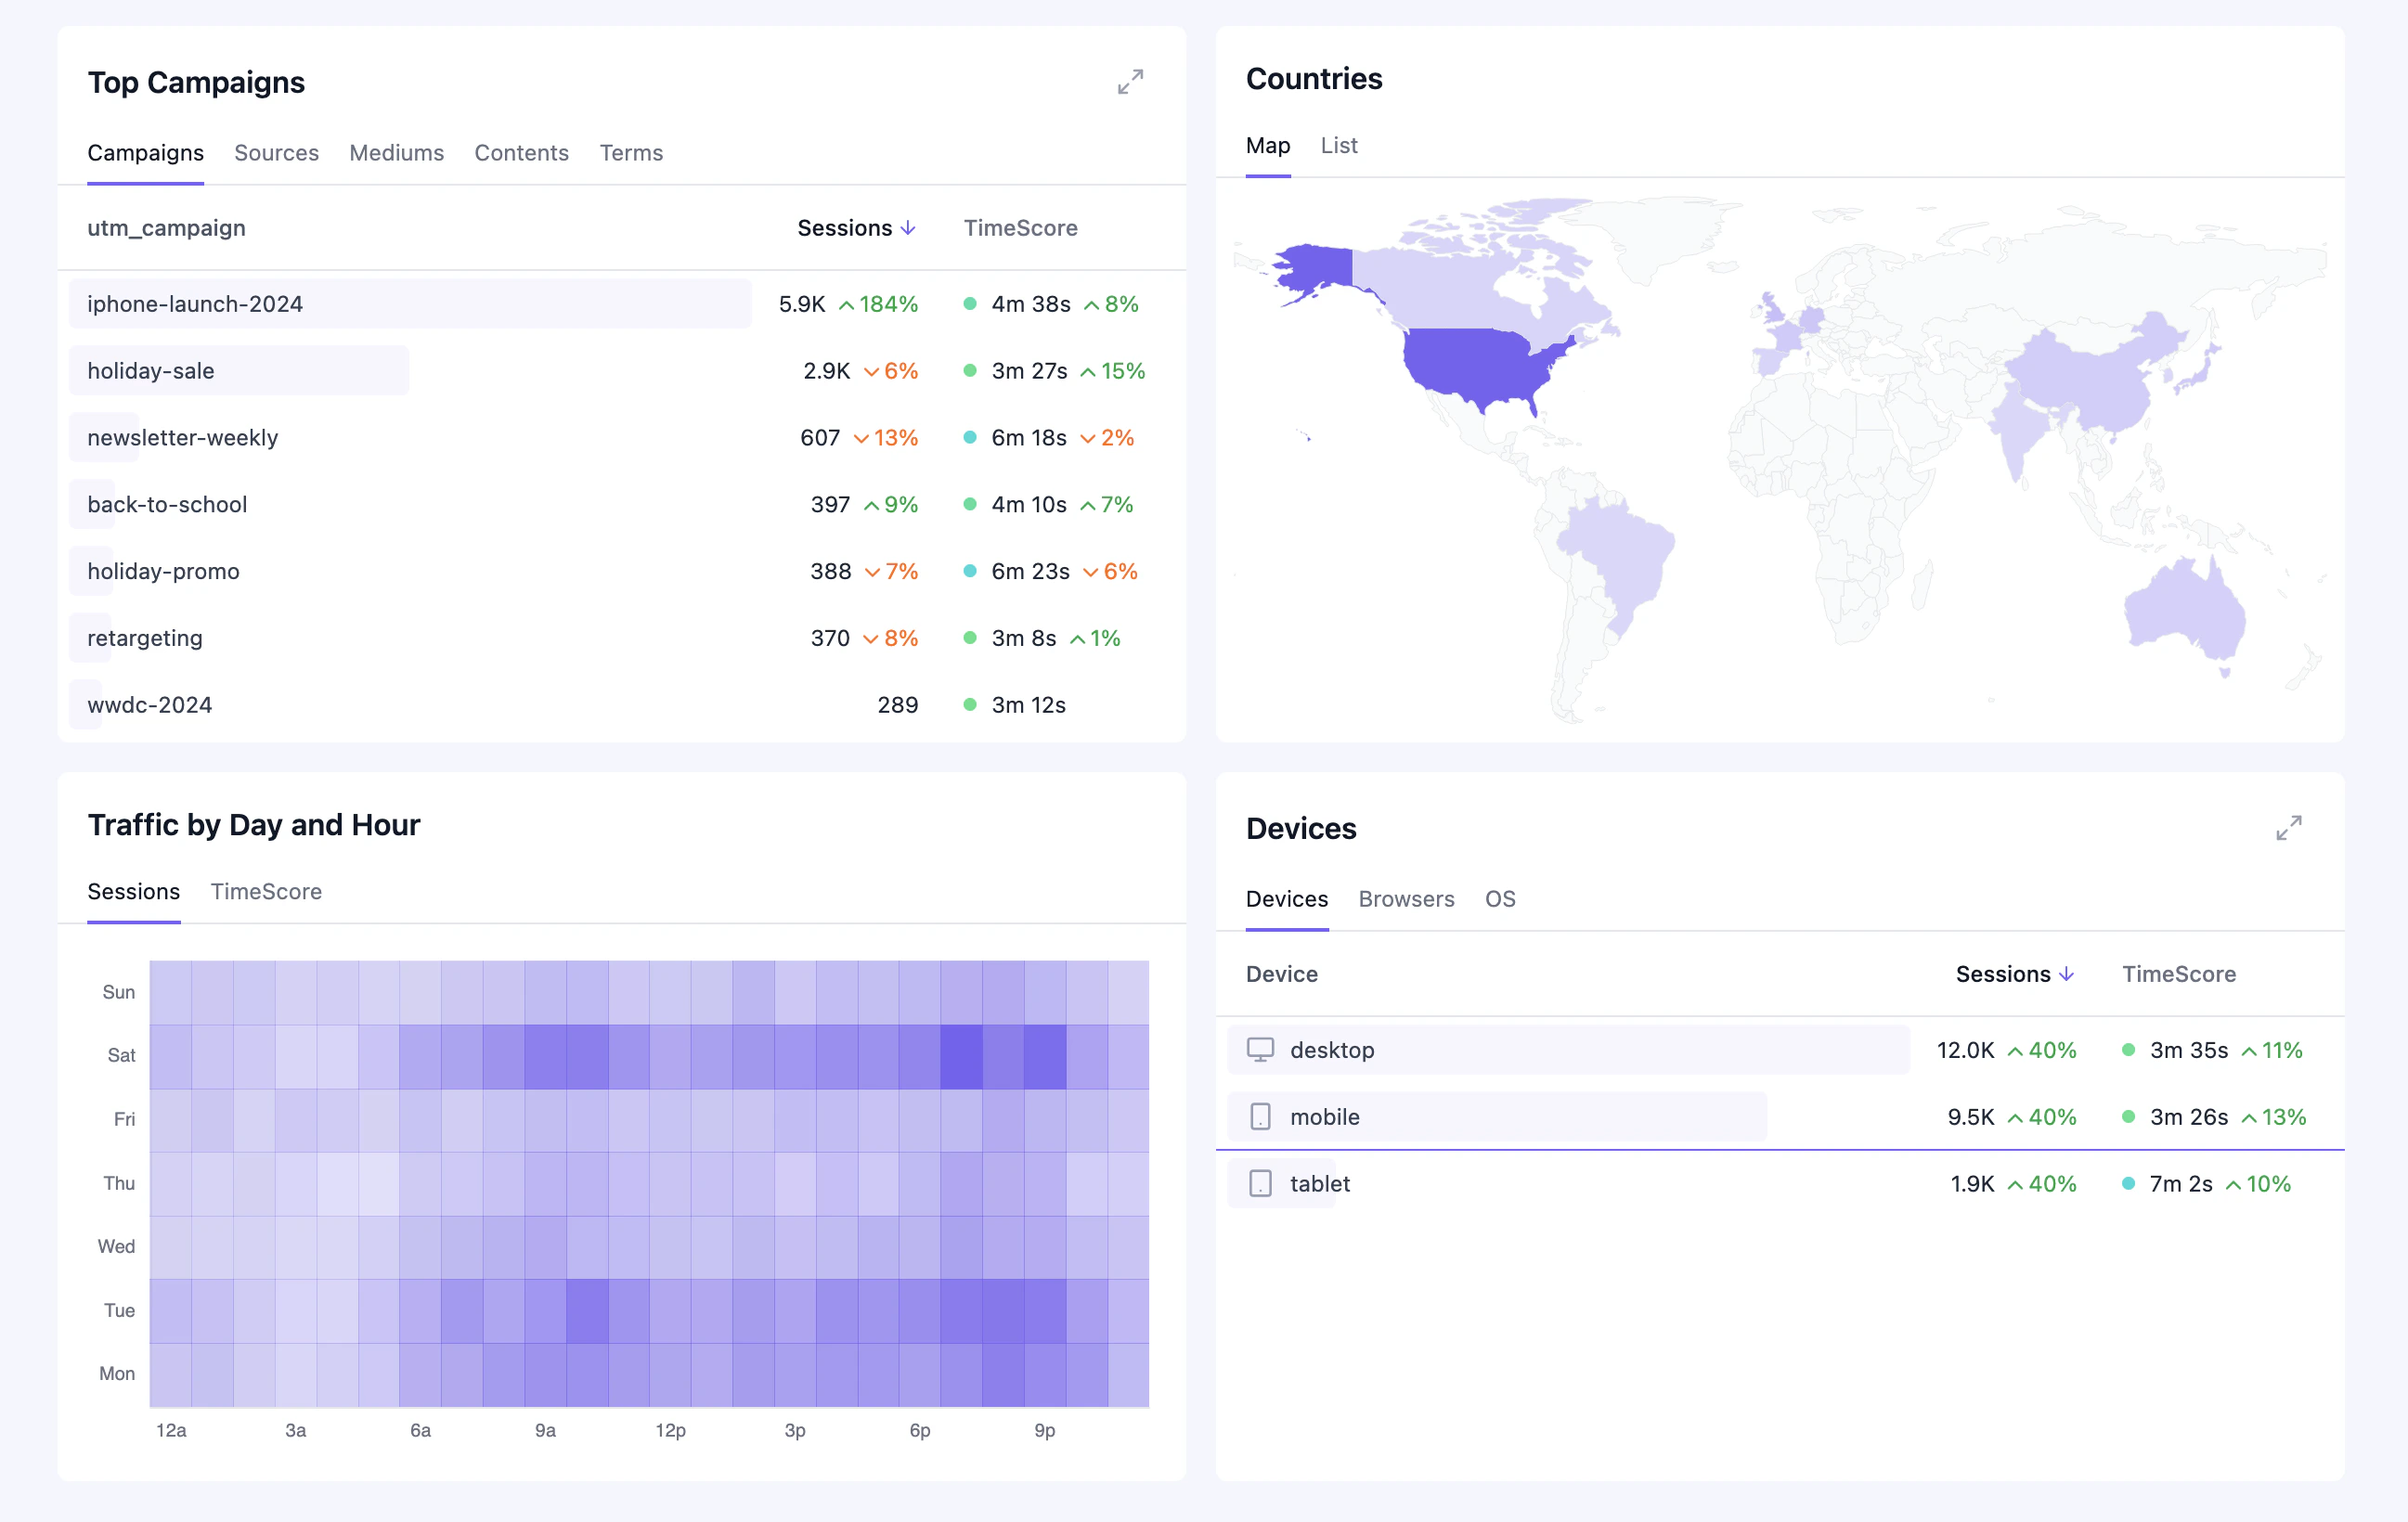 The dashboard includes several widgets to break down your traffic:
| Widget | Tabs | Description |
| ------------------- | -------------------------------------------- | ---------------------------------------- |
| **Top Pages** | Landing pages, Exits | Most visited entry and exit pages |
| **Top Sources** | Referrers, Channels, Channel groups | Where your traffic comes from |
| **Top Campaigns** | Campaigns, Sources, Mediums, Contents, Terms | UTM parameter breakdown |
| **Countries** | Map, List | Geographic distribution of visitors |
| **Traffic Heatmap** | Sessions, TimeScore | Traffic patterns by day of week and hour |
| **Devices** | Devices, Browsers, OS | Technical breakdown of visitors |
### Click-to-Filter
Click any row in a widget to instantly filter the entire dashboard by that value. For example:
* Click a channel to see only traffic from that channel
* Click a country to focus on that geographic region
* Click a landing page to analyze traffic to that specific page
Click the same row again to remove the filter. Active filters appear below the date picker.
## Real-Time View
Click the **Live** button next to the dashboard title to open the real-time view. This shows visitors currently active on your site in the last 30 minutes.
The dashboard includes several widgets to break down your traffic:
| Widget | Tabs | Description |
| ------------------- | -------------------------------------------- | ---------------------------------------- |
| **Top Pages** | Landing pages, Exits | Most visited entry and exit pages |
| **Top Sources** | Referrers, Channels, Channel groups | Where your traffic comes from |
| **Top Campaigns** | Campaigns, Sources, Mediums, Contents, Terms | UTM parameter breakdown |
| **Countries** | Map, List | Geographic distribution of visitors |
| **Traffic Heatmap** | Sessions, TimeScore | Traffic patterns by day of week and hour |
| **Devices** | Devices, Browsers, OS | Technical breakdown of visitors |
### Click-to-Filter
Click any row in a widget to instantly filter the entire dashboard by that value. For example:
* Click a channel to see only traffic from that channel
* Click a country to focus on that geographic region
* Click a landing page to analyze traffic to that specific page
Click the same row again to remove the filter. Active filters appear below the date picker.
## Real-Time View
Click the **Live** button next to the dashboard title to open the real-time view. This shows visitors currently active on your site in the last 30 minutes.
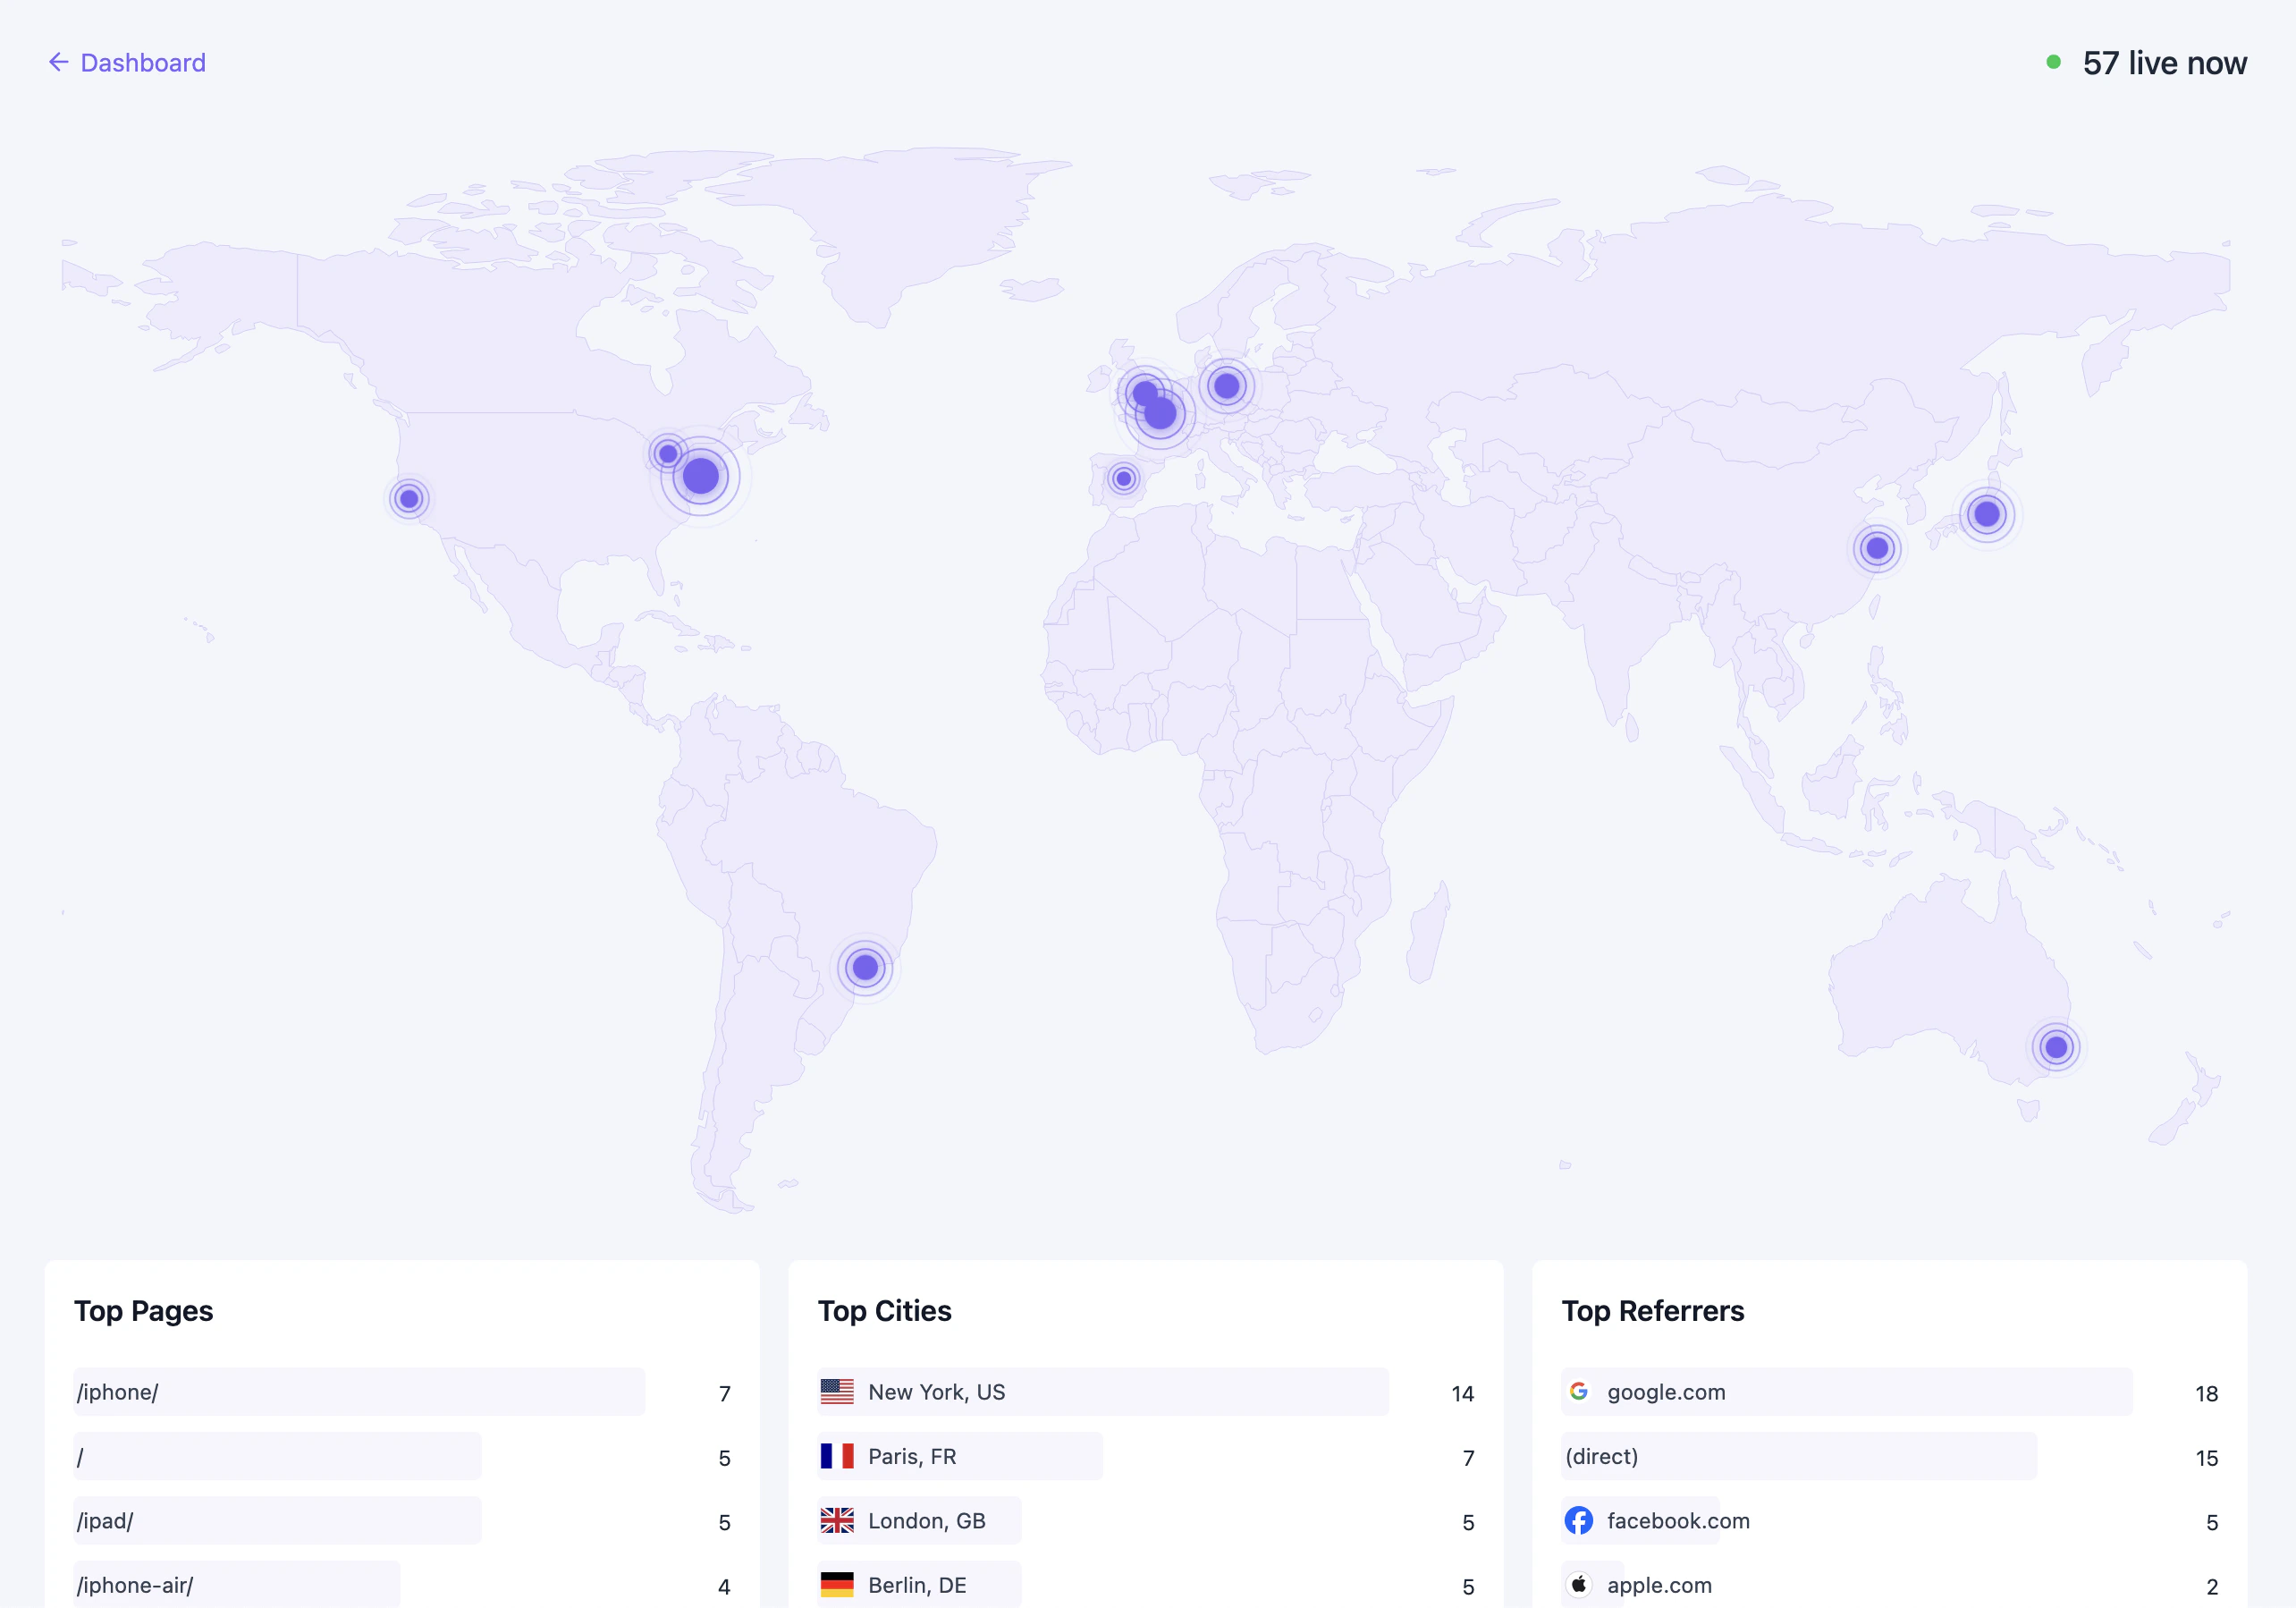 The real-time view includes:
* **World map** — See where active visitors are located
* **Live metrics** — Current session count and engagement
* **Active pages** — Pages being viewed right now
* **Live sources** — Channels, referrers, and campaigns driving current traffic
* **Devices** — Real-time device and browser breakdown
Use the real-time view to monitor campaign launches, check if tracking is working after deploying the SDK, or watch traffic during peak events.
The real-time view includes:
* **World map** — See where active visitors are located
* **Live metrics** — Current session count and engagement
* **Active pages** — Pages being viewed right now
* **Live sources** — Channels, referrers, and campaigns driving current traffic
* **Devices** — Real-time device and browser breakdown
Use the real-time view to monitor campaign launches, check if tracking is working after deploying the SDK, or watch traffic during peak events.