> ## Documentation Index
> Fetch the complete documentation index at: https://docs.staminads.com/llms.txt
> Use this file to discover all available pages before exploring further.
# Annotations
> Mark significant events on your charts for better context
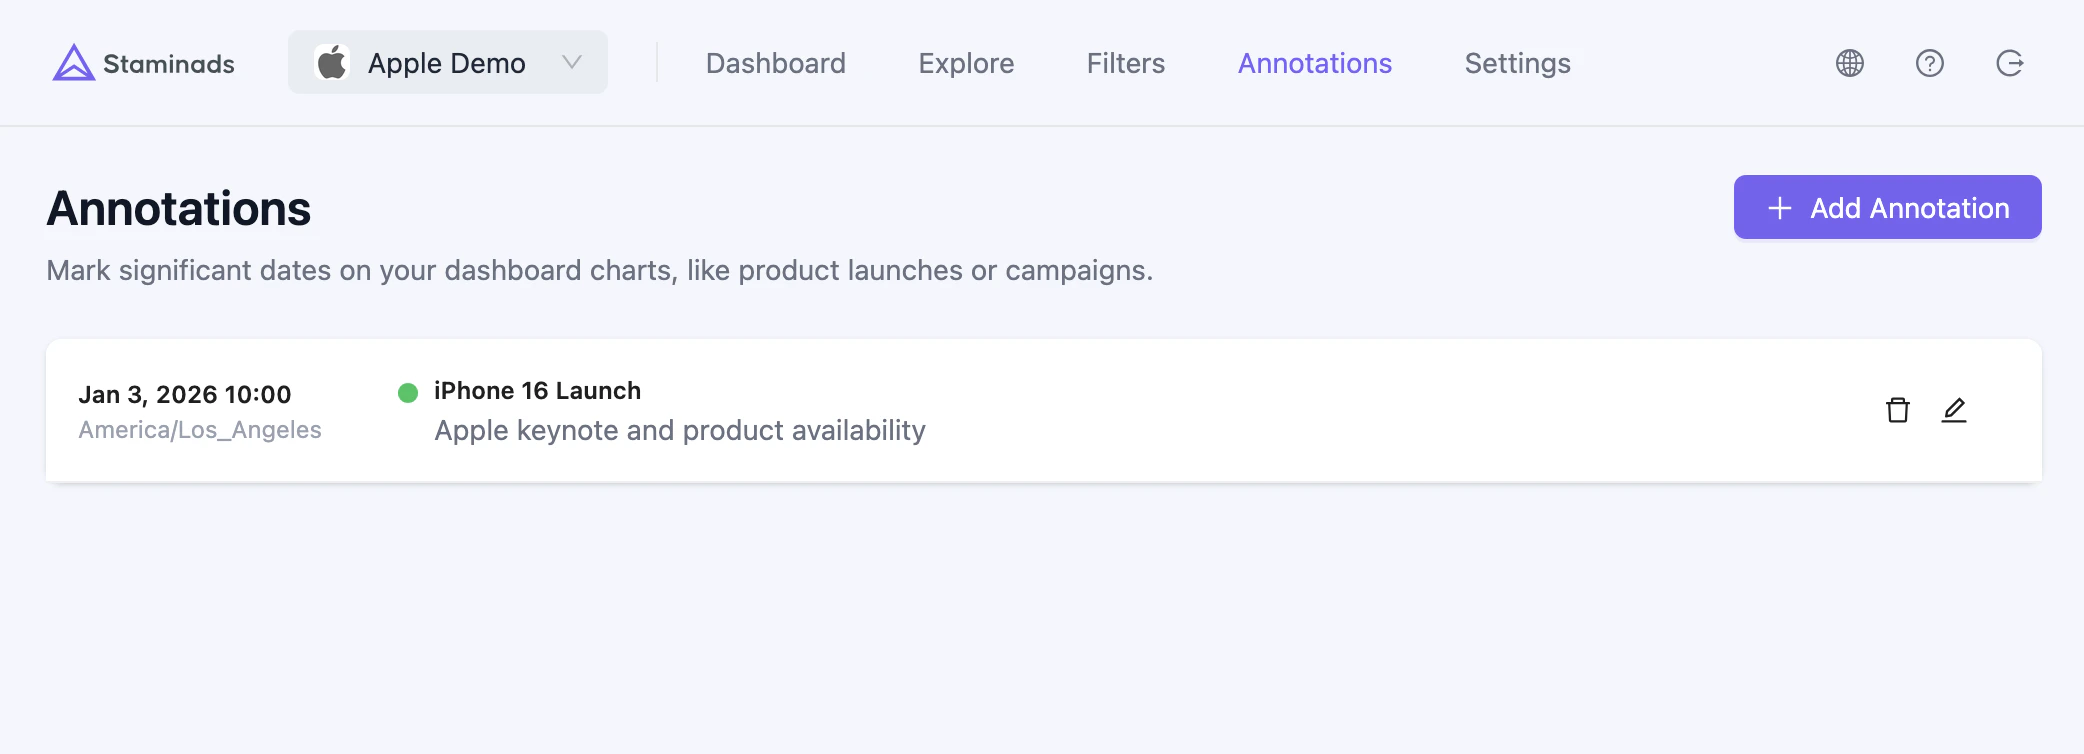
Annotations let you mark significant dates on your charts, helping you correlate traffic patterns with real-world events like campaigns, product launches, or website changes.
 ## Use Cases
* **Campaign launches** — Mark when a new ad campaign started to see its impact on traffic
* **Website changes** — Track deployments, redesigns, or content updates
* **External events** — Note industry events, holidays, or competitor actions
* **Technical issues** — Document outages or tracking issues for future reference
* **Seasonal patterns** — Mark recurring events to compare year-over-year
## Creating an Annotation
Navigate to **Settings > Annotations** in your workspace to manage annotations.
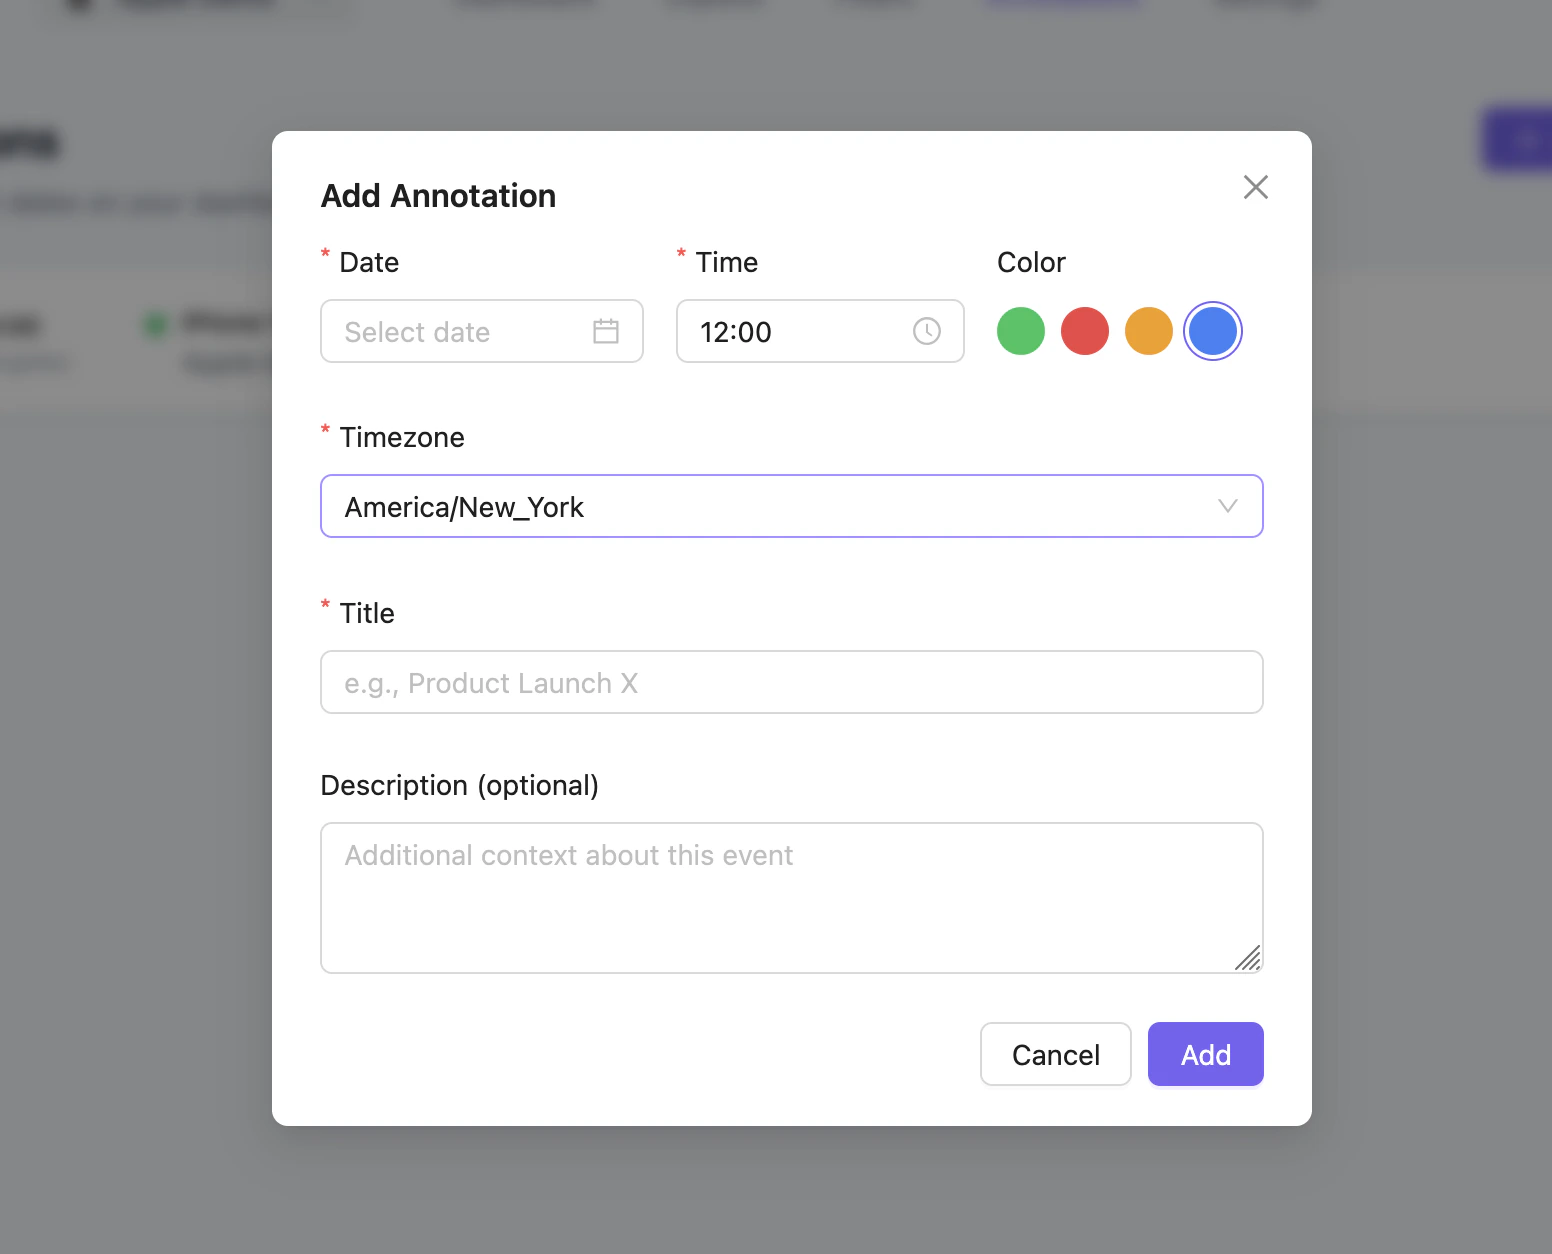
Each annotation includes:
| Field | Description |
| --------------- | ------------------------------------------------------------ |
| **Date** | The date of the event (YYYY-MM-DD format) |
| **Time** | The specific time of the event (HH:mm format) |
| **Timezone** | The timezone for the event (e.g., America/New\_York) |
| **Title** | A short label displayed on the chart |
| **Description** | Optional details about the event |
| **Color** | Custom color for the annotation marker (defaults to #7763f1) |
## Use Cases
* **Campaign launches** — Mark when a new ad campaign started to see its impact on traffic
* **Website changes** — Track deployments, redesigns, or content updates
* **External events** — Note industry events, holidays, or competitor actions
* **Technical issues** — Document outages or tracking issues for future reference
* **Seasonal patterns** — Mark recurring events to compare year-over-year
## Creating an Annotation
Navigate to **Settings > Annotations** in your workspace to manage annotations.
Each annotation includes:
| Field | Description |
| --------------- | ------------------------------------------------------------ |
| **Date** | The date of the event (YYYY-MM-DD format) |
| **Time** | The specific time of the event (HH:mm format) |
| **Timezone** | The timezone for the event (e.g., America/New\_York) |
| **Title** | A short label displayed on the chart |
| **Description** | Optional details about the event |
| **Color** | Custom color for the annotation marker (defaults to #7763f1) |
 ## Viewing Annotations
Annotations appear as vertical markers on time-series charts. Hover over a marker to see the annotation details.
Use consistent colors to categorize your annotations. For example, use blue for campaigns, green for releases, and red for incidents.
## Best Practices
1. **Be specific** — Include enough detail in the description to understand the event months later
2. **Use accurate times** — Set the correct timezone to align annotations with your traffic data
3. **Keep titles short** — Use concise titles that fit on the chart without cluttering
4. **Clean up old annotations** — Remove annotations that are no longer relevant to keep charts readable
## Viewing Annotations
Annotations appear as vertical markers on time-series charts. Hover over a marker to see the annotation details.
Use consistent colors to categorize your annotations. For example, use blue for campaigns, green for releases, and red for incidents.
## Best Practices
1. **Be specific** — Include enough detail in the description to understand the event months later
2. **Use accurate times** — Set the correct timezone to align annotations with your traffic data
3. **Keep titles short** — Use concise titles that fit on the chart without cluttering
4. **Clean up old annotations** — Remove annotations that are no longer relevant to keep charts readable